Subsystem 01 · EE32015
Mechatronics Subsystem
Tracked skid-steer chassis: geometry, suspension, drivetrain sizing and the 24 V power architecture.
Sections
Design Concept Description
The mechatronic subsystem is a tracked chassis designed to transport the robotic manipulator, sensing suite, and payloads through complex environments. The design proposes a platform for precise navigation and manipulation tasks, considering traction, stability under dynamic loads, and energy performance.
Tracked propulsion was chosen over wheeled platforms as a result of superior traction and climbing performance on uneven terrain. A rocker–bogie configuration was considered but rejected due to its higher effective centre of gravity, which is critical during manipulator operation with a heavy payload. The skid-steer configuration also provides high obstacle tolerance whilst enabling zero-radius turning within confined spaces.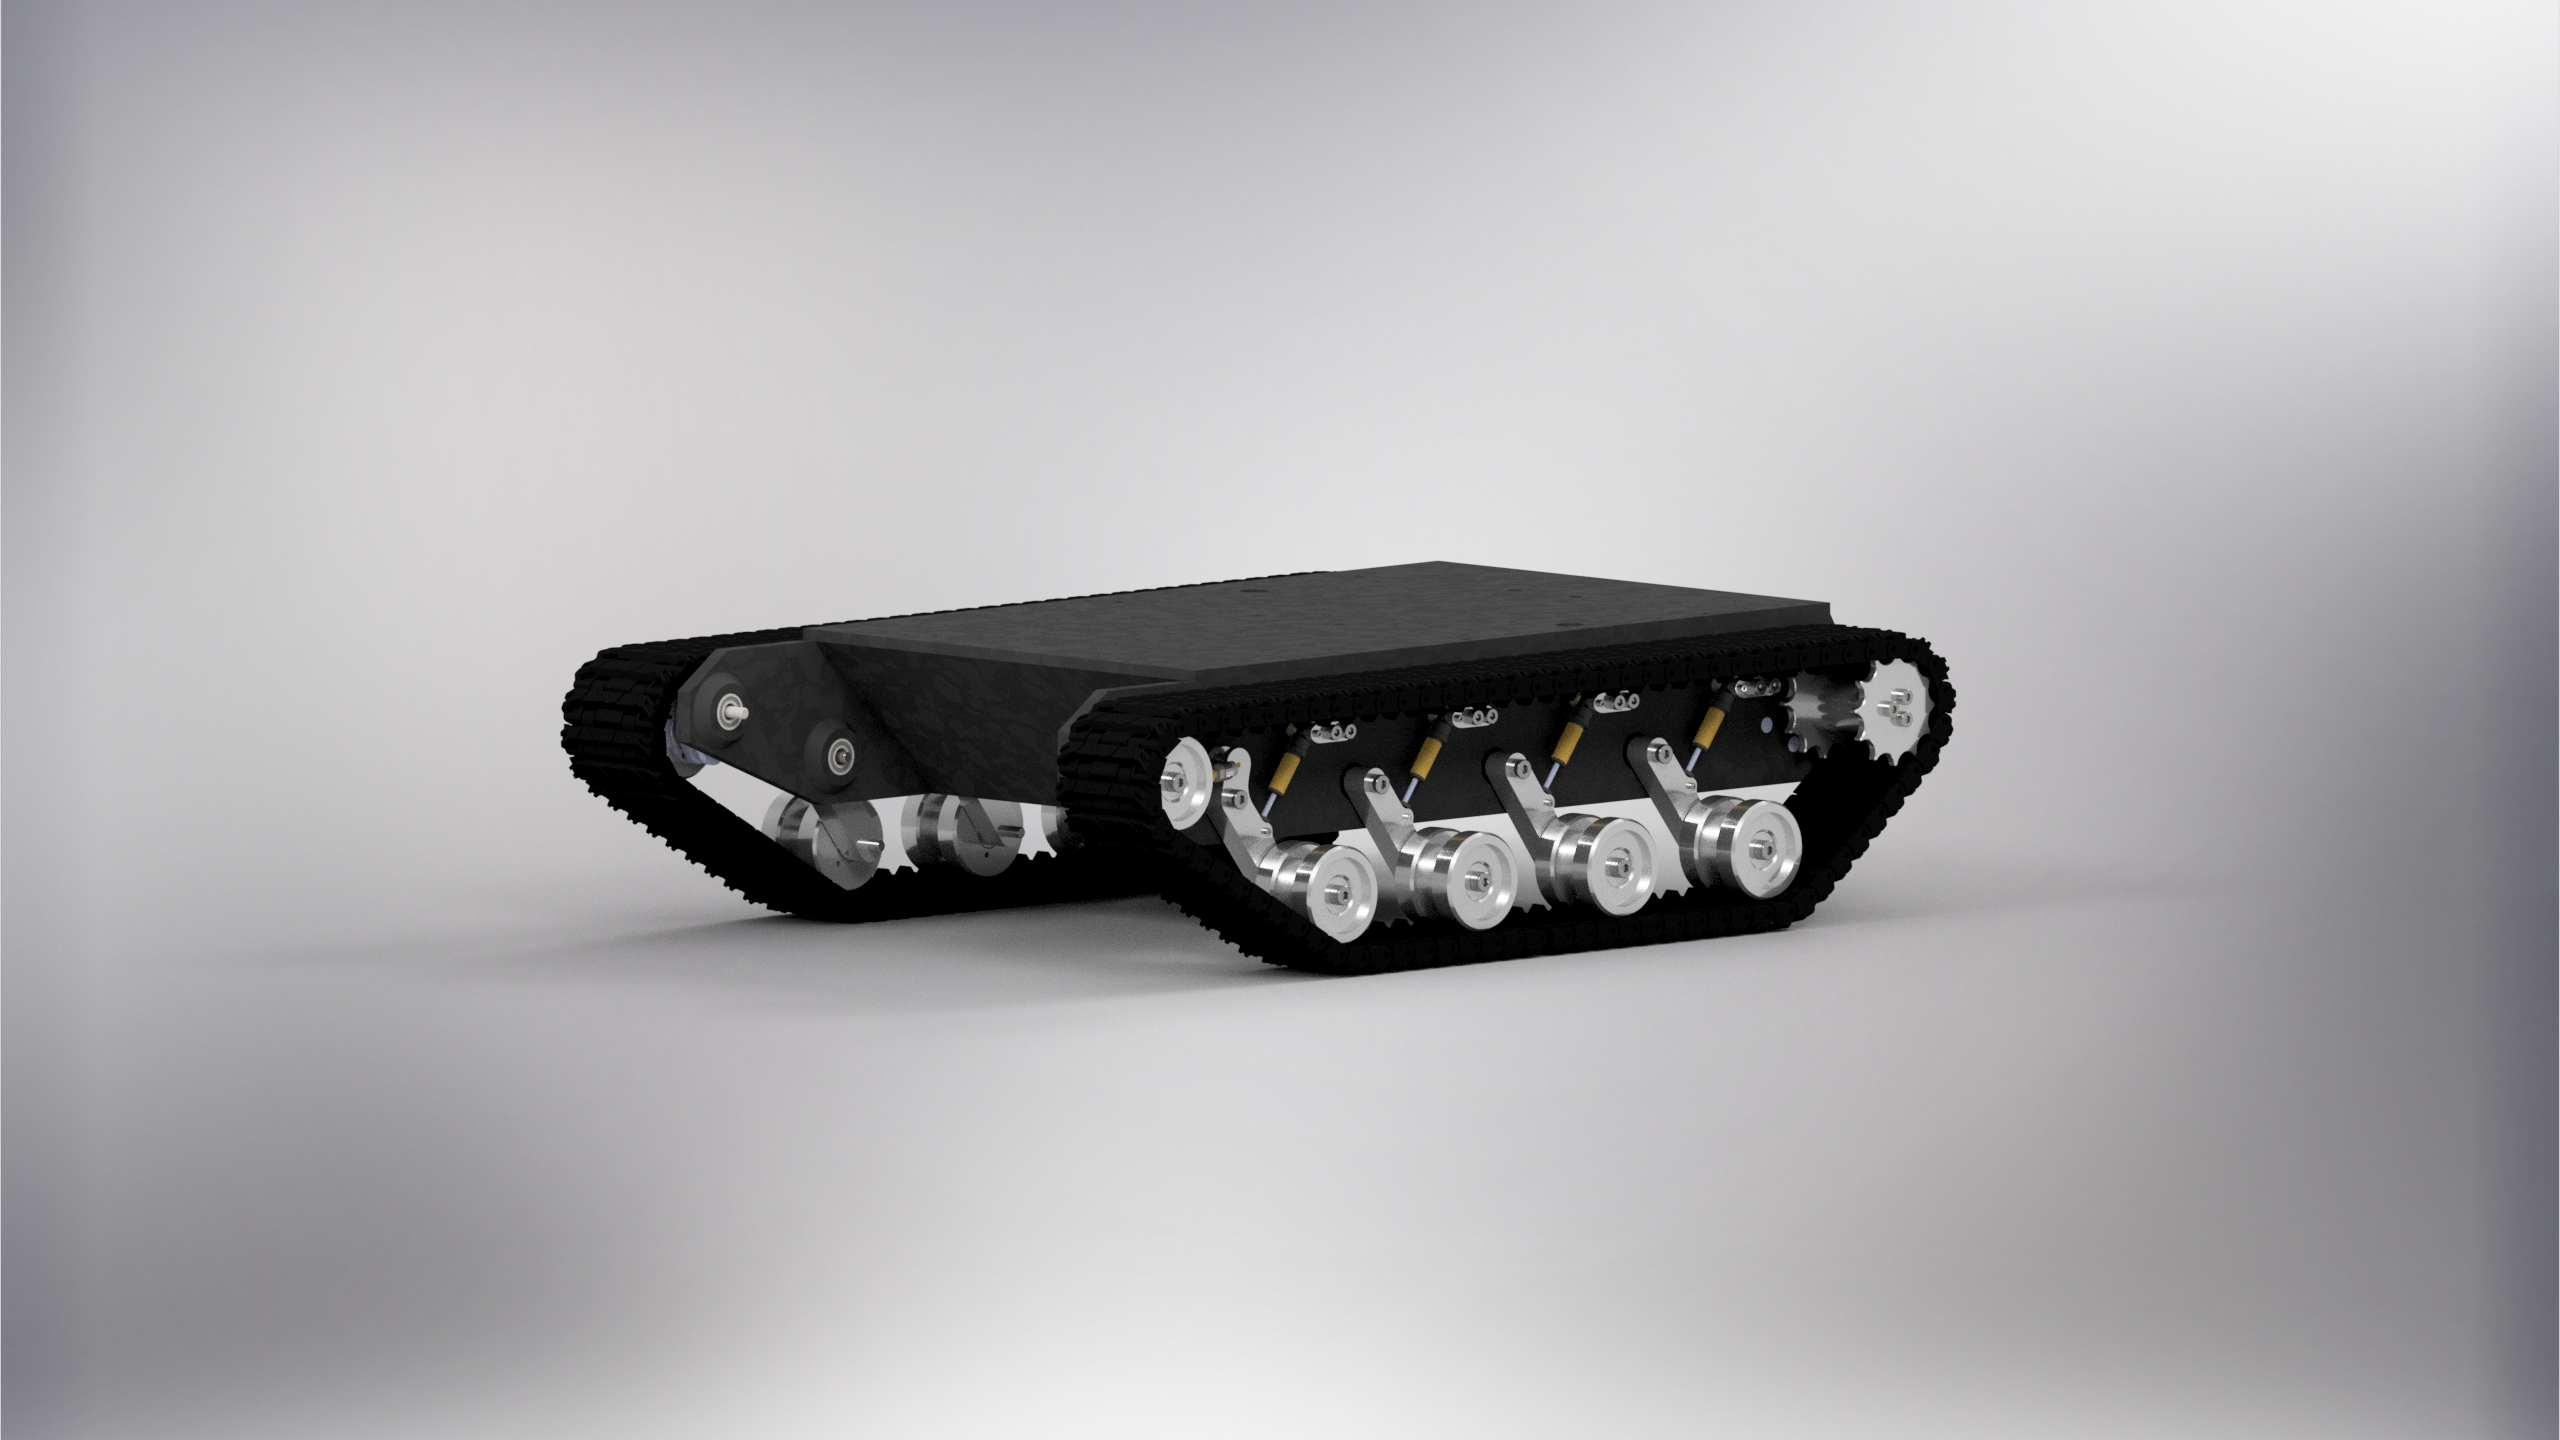
Figure A1 – Tracked chassis concept CAD render.
The chassis is driven by two 24V DC motors with integrated planetary gearboxes, transmitting torque through the rear sprockets. Spring-damper elements limit pitch and heave whilst maintaining continuous ground contact. Major masses: battery, motor drives and controllers are packaged centrally between the tracks, minimising centre of gravity height and improving stability during payload handling.
A 24V DC bus powered by a 10Ah Li-ion battery supplies the drive, arm and auxiliary systems. The Simulink power electronics model developed predicts cumulative energy demand within battery limits, enabling 8 full missions per charge [Section D4.3].
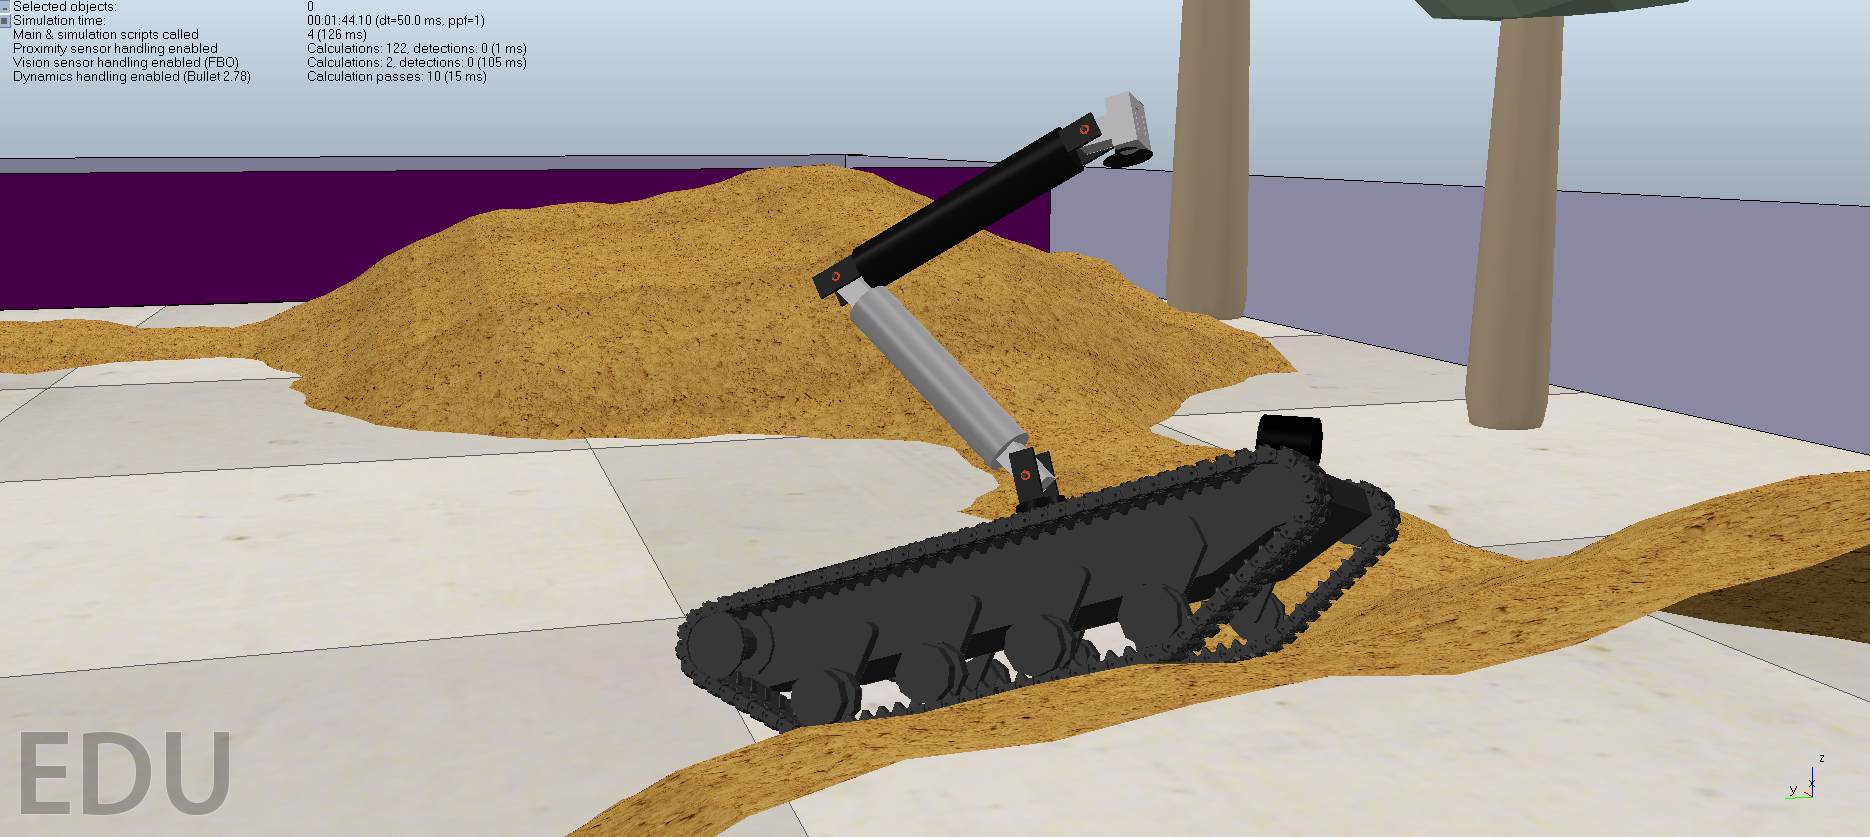
Figure A2 – Full rover system design in Coppelia.
Requirements definition and analysis
|
SYS Requirement |
MECH Subsidiary |
Description |
Real-world considerations |
|
SYS05 Rough ground & slopes |
M01 Slope drive torque |
Tracked drive must generate sufficient tractive force to climb 10% gradient at maximum system mass. |
Slopes will not have ideal surfaces; therefore, extra torque margin is likely required. |
|
M02 Traction margin |
Normal force and track contact length must provide sufficient friction to climb 10% gradient with 12.75kg load, assuming surface friction μ = 0.6. |
μ will be lower on loose debris or wet surfaces. Hardware will require slip detection. |
|
|
M03 Chassis ground clearance |
Provide ground clearance ≥ 0.2m (Section D1.1) to avoid grounding on terrain or debris. |
Suspension deflection under dynamic loads and soft ground sinkage will reduce clearance. In practice, underside protection may be required. |
|
|
SYS06 Steps |
M04 Track radius and wheelbase |
Navigate 0.2m steps without pitch-over and with continuous track contact during transitions. |
Steps unlikely to meet nominal dimensions – likely variation in geometry. |
|
SYS07 Aperture and rooms SYS06 |
M05 Chassis envelope |
System must be able to manoeuvre within defined 3x3x2m envelope and pass through 3.2m minimum aperture (double-door). Must be narrower than 1m to navigate minimum step width. |
Physical design needs allowance for protective guards and additional clutter within spaces. |
|
SYS09 Object properties |
M06 Holding torque |
Drive system should hold position on a 10% slope whilst carrying the payload, with rollback ≤ 0.2m. |
Motor torque falls will bus voltage and temperature; likely to need a mechanical brake. |
|
SYS08 Operating endurance/range SYS12 Mission time |
M07 Nominal speed |
Achieve cruise speed vnom 1.5m/s and maximum speed vmax = 2.5m/s. |
Low friction surfaces reduce achievable speed. |
|
M08 Battery capacity |
Battery should provide sufficient energy for ≥1 full mission with ≥30% energy reserve. |
Capacity decreases with temperature and ageing; battery packs will need further margin. |
|
|
M09 Power electronics current rating |
Power electronics must support continuous and peak drive currents and total DC-bus power with ≥ 20% electrical margin, without exceeding datasheet limits. |
Current spikes and unequal track loading can push devices beyond their ratings. |
|
|
M10 Power monitoring |
Chassis power system should monitor bus voltage, per-motor current, and cumulative energy consumption so that the power budget can be validated from simulation logs. |
Real sensors have noise and drift; EM interference can corrupt measurements. Therefore, diagnostic flags for sensor faults and redundancy required. |
Figure B1 – Mechatronic subsystem requirements table.
The mechatronic subsystem requirements were derived from the arena constraints, payload specification, and mission profile defined by the system requirements. Key performance drivers include handling of difficult terrain, manoeuvrability within confined spaces, stability under dynamic loads, and sufficient energy capacity for repeated missions. Conservative requirements were set to allow for modelling uncertainty and real-world inefficiencies
Test plan and definition of success
|
Requirement |
Simulation test and limitation |
Real-world test |
Success metric |
|
M01 |
10% slope climb and pull-away. Limitation: ideal μ; no thermal or voltage sag. |
10% ramp, max load; torque/current logged. |
\( |\tau_{\mathrm{drive}}| \le \tau_{\mathrm{limit}} \) |
|
M02 |
Re-run M01 with μ = 0.6. Limitation: no debris or local μ variation. |
Dry and low-μ surfaces; slip observed. |
\[ \omega_{\mathrm{actual}} \ge 0.9\,\omega_{\mathrm{cmd}} \] |
|
M03 |
Traverse 0.2 m step and debris. Limitation: ideal contact; no wear. |
Physical obstacles; underside inspection. |
\[ \mathrm{Clearance} \ge 0.20~\mathrm{m} \] |
|
M04 |
Step ascent/descent with payload without pitch over. Limitation: perfect edges. |
Repeated climbs, recording pitch via a chassis IMU. |
\[ \theta_{\max} \le 32^\circ \] |
|
M05 |
Confined space drive and zero-radius turn. Successful traversal of 1m wide steps. Limitation: no clutter or misalignment. |
3×3 m space; door traversal. |
Turn ≤ 1.2 m No contact Navigates min step width without falling. |
|
M06 |
Hold stationary on 10% slope for 10s. Limitation: no creep. |
Park-hold on ramp; rollback measured. |
Δs ≤ 0.2 m |
|
M07 |
Cruise speed and max speed test. Limitation: no operator delay. |
Timed mission trials. |
\[ v_{\mathrm{nom}} = 1.5 \pm 0.1~\mathrm{m\,s^{-1}} \] \[ v_{\max} = 2.5 \pm 0.1~\mathrm{m\,s^{-1}} \] |
|
M08 |
Integrate DC-bus energy over mission. Limitation: no ageing or temperature effects. |
BMS / coulomb count per mission. |
\[ E_{\mathrm{mission}} \le 70\% \] |
|
M09 |
Extract bus power and currents from the mission power model. Limitation: transient spikes ignored. |
BMS and logged telemetry over a representative mission. |
\[ I_{\mathrm{rms}} \le I_{\mathrm{rated}}, \qquad I_{\mathrm{peak}} \le I_{\mathrm{rated}} \] \[ P_{\mathrm{bus,peak}} < P_{\mathrm{battery,cont}} \] |
|
M10 |
Verify power logging ≥10 Hz. Limitation: ideal sensors; no dropouts. |
Bench test + fault injection. |
All signals logged; faults flagged. |
Figure C1 – Test plan and success matrix.
Detailed design
D1 Geometry and mass envelope
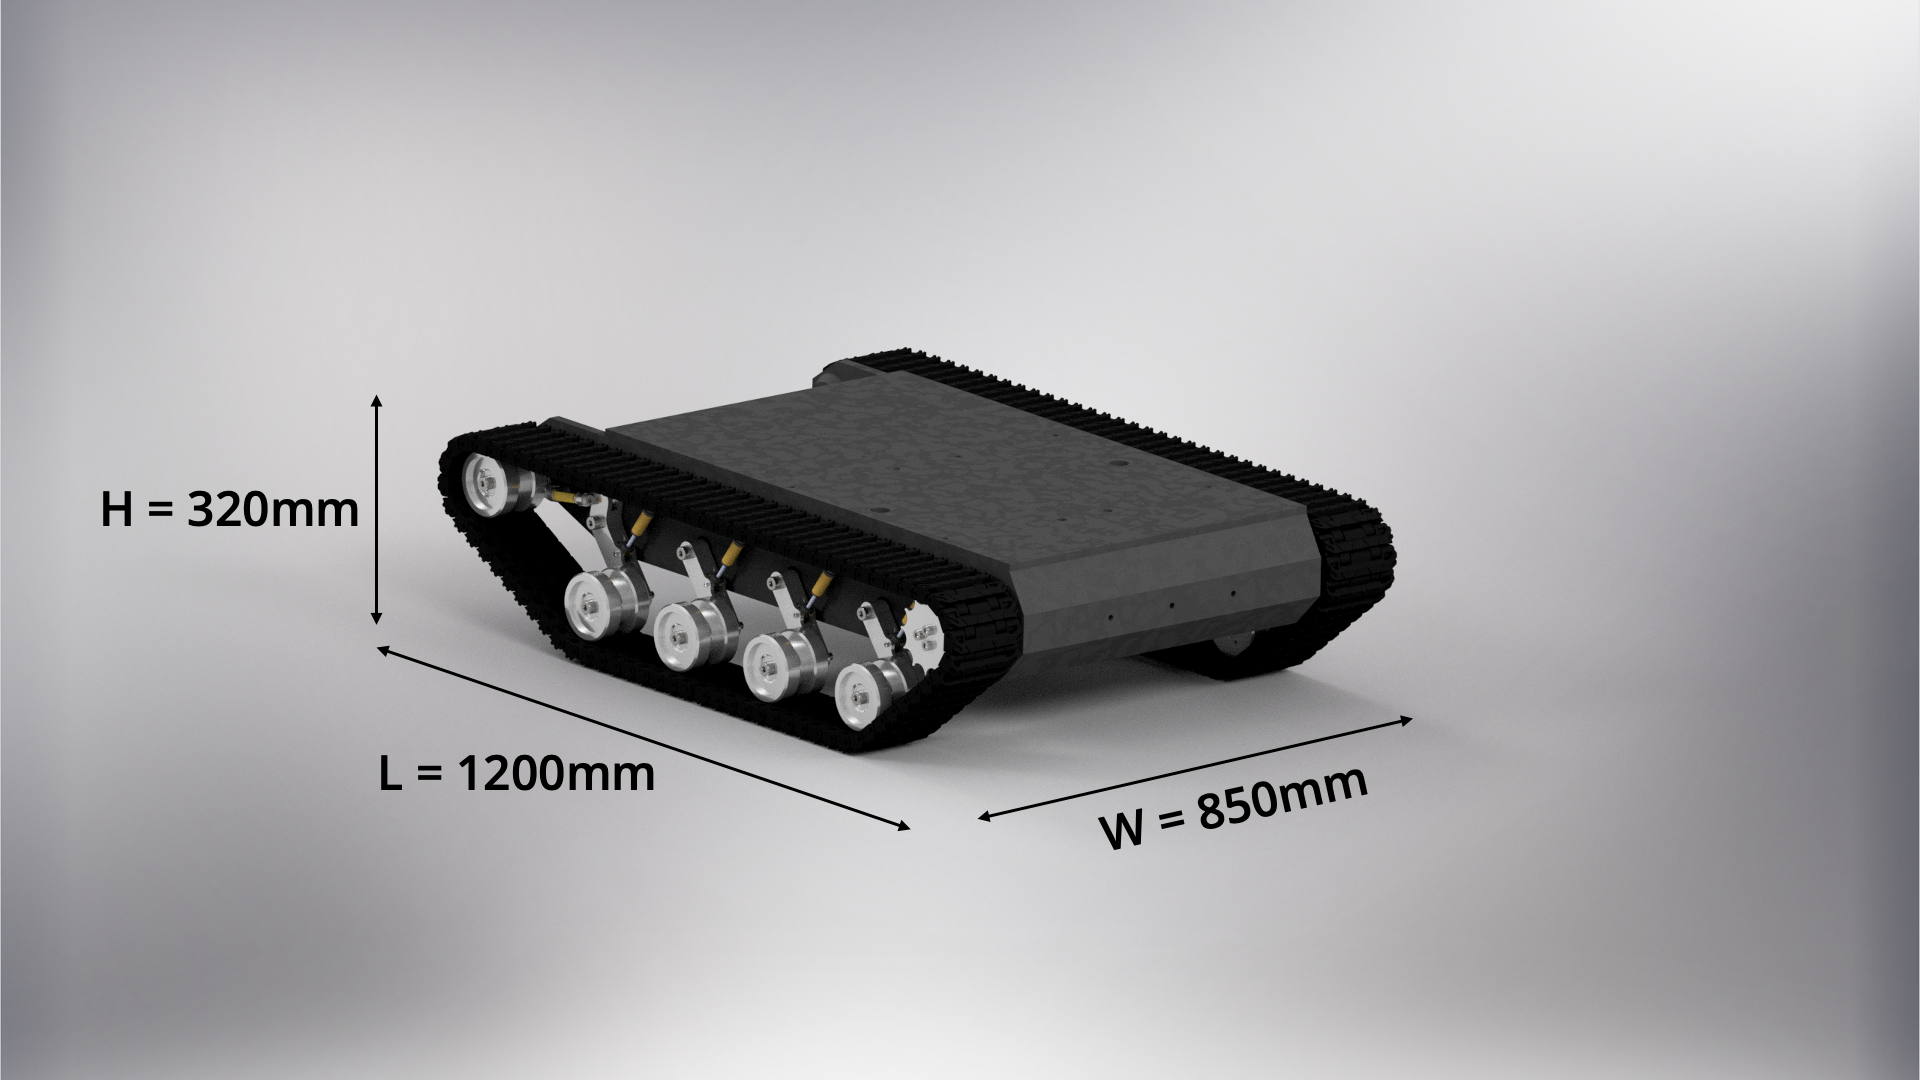
Figure D1.1 – Geometry envelope of chassis.
The rover geometry and mass envelope were defined early in the design process to ensure the compatibility with the operating environment and to constrain subsystem development. All dimensions and mass estimates are derived from a CAD assembly of the chassis, tracks, suspension and drive motors. CAD development was carried out in parallel with simulation to ensure geometric feasibility prior to dynamic verification.
|
Parameter |
Value (m) |
Rationale |
|
Track diameter |
0.3 |
Exceeds step height with margin |
|
Ground clearance |
0.22 |
Clears fallen containers + terrain margin |
|
Overall width |
0.85 |
Minimum step width |
|
Overall length |
1.2 |
Turning and enclosure fit |
Figure D1.2 – Final chassis geometry.
D1.1 Geometry selection and spatial constraints
The chassis geometry was governed by three primary constraints:
- terrain traversal (steps, fallen containers, ramps),
- access through confined indoor spaces,
- stability during arm operation carrying 12.75kg biohazard
Figure D1.3 – Fallen biohazard clearance.
The highest chassis clearance requirement arises from fallen biohazard containers present within the operating environment.
These containers have a diameter of 0.20m and may be straddled during navigation. A minimum ground clearance of 0.22m was therefore selected to ensure underbody clearance whilst keeping the centre of gravity as low as practicable. Reducing the centre of gravity directly limits both pitch-over during obstacle traversal and roll-over during turning and sloped navigation.
Figure D1.4 – Chassis breakover angle.
A secondary breakover condition was evaluated to assess the risk of high centring over convex terrain features. The breakover angle is defined as
\[ \beta = 2\,\tan^{-1}\!\left(\frac{2h}{L}\right) \]
where h is the minimum chassis ground clearance and L is the effective track ground-contact length (Appendix M2).
For the selected geometry, the resulting breakover angle of approximately 40° exceeds all anticipated terrain features within the operating environment. In addition, the risk of high centring is further reduced by the tracked bogie layout, which distributes contact over multiple wheels and accommodates local height variations.
Front and rear approach/departure angles are maximised by allowing the tracks to lead ahead of the chassis structure, resulting in minimal overhang. Consequently, the dominant geometric limits during obstacle engagement are imposed by suspension geometry rather than by chassis interference.
Figure D1.5 – Lateral clearance in double door constraint and minimum enclosure size.
The chassis footprint constraints were assessed using the environmental dimensions defined in the system requirements (SYS07). The double-door opening provides a total clear width of 3.2m. This provides 2m of lateral clearance under worst-case orientation.
The tracked configuration allows zero radius turning; hence manoeuvrability is not constrained by wheel steering geometry. As a result, the rover can reorient within the 3 × 3 m minimum closure with sufficient clearance.
D1.2 Track radius and wheelbase
Figure D1.7 – Chosen track diameter.
A 0.3m track diameter was selected to satisfy the 0.2m step height traversal requirement, which represents the most demanding obstacle for initial track engagement due to its vertical leading edge. A conservative geometric criterion \[ R_{\min} = \frac{h}{2} \] was applied and a 1.5× safety factor added to account for uneven contact and suspension compression (Appendix M1).
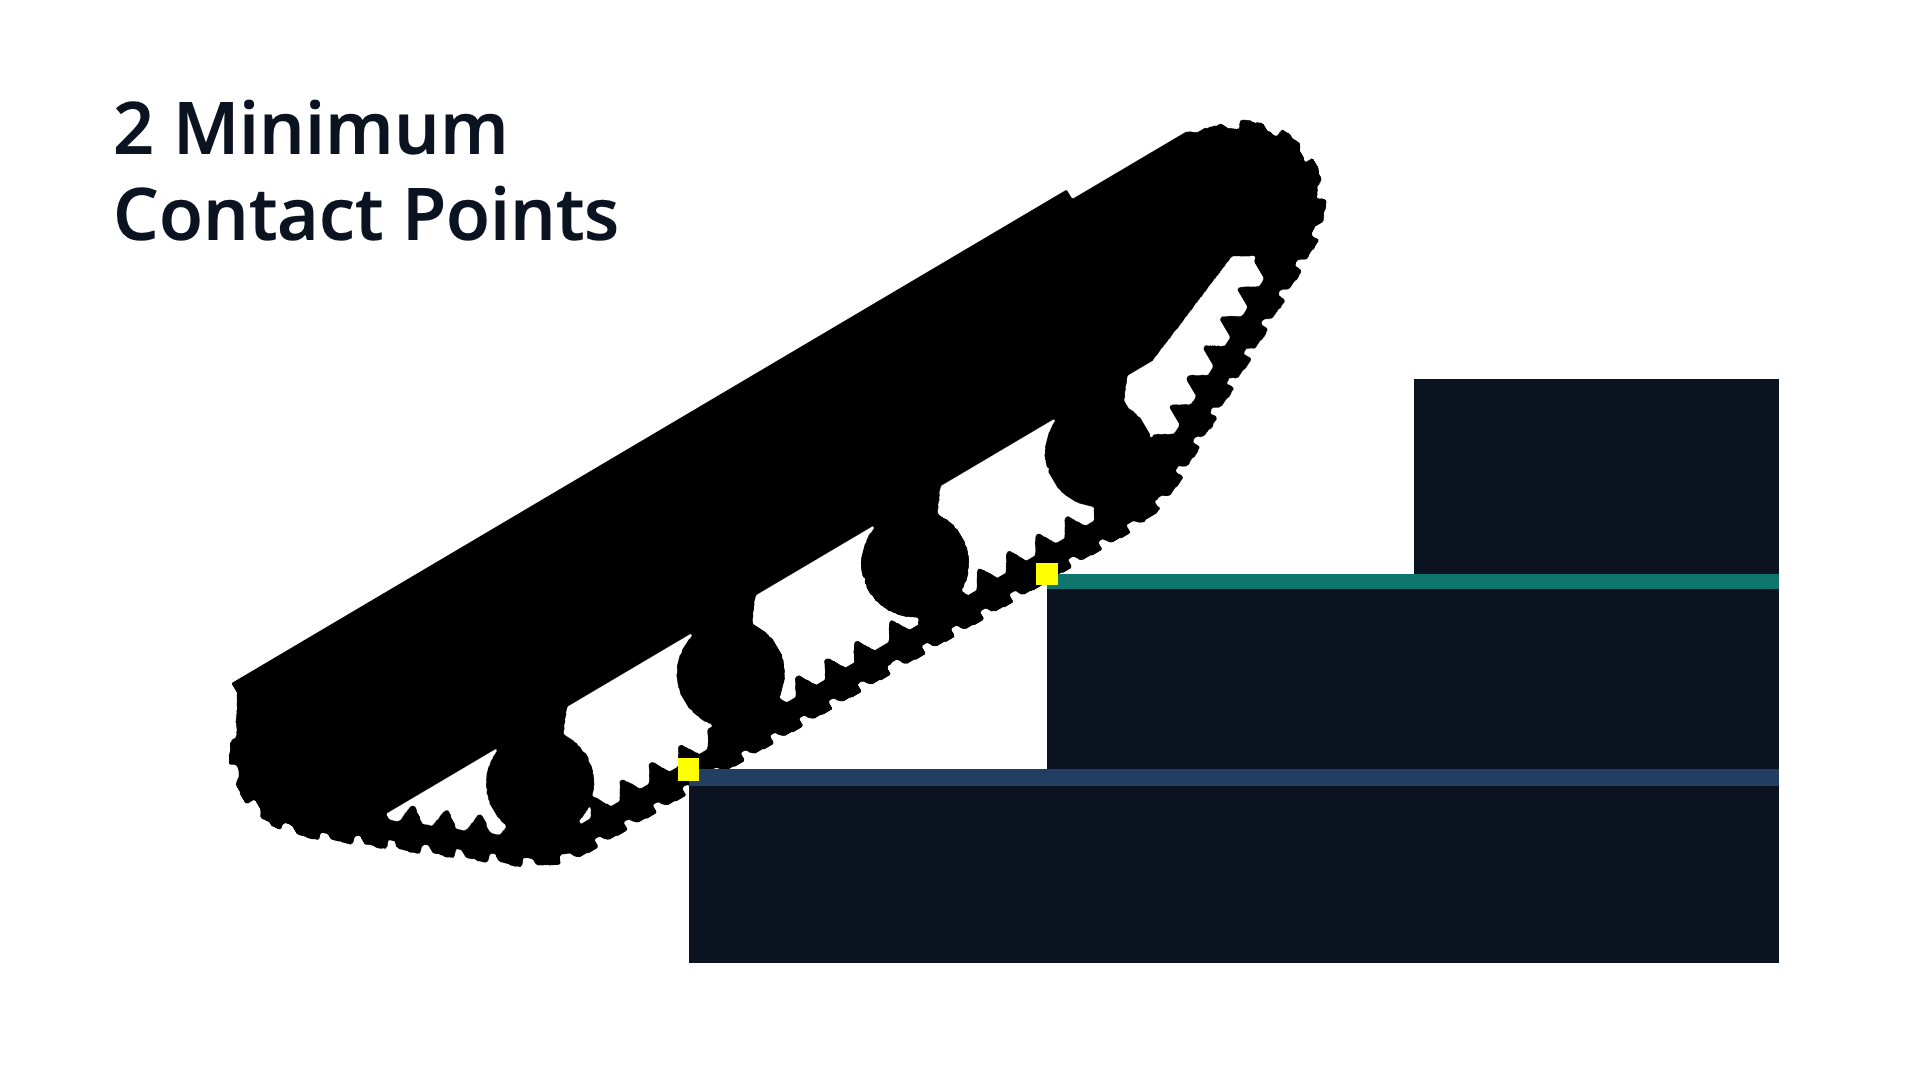
The wheelbase was set to 1.2m to maintain continuous contact during stair ascent. For the worst-case stair geometry (SYS06), the minimum spacing between successive treads is 0.54m, giving a two-contact requirement of: \[ L_{\min} = 2d = 1.08~\mathrm{m} \]
The selected wheelbase therefore exceeds the minimum two contact point requirement (M06), ensuring sustained traction and reducing pitch-over risk under payload loading. [3]
A mass budget was compiled to support drive sizing and energy modelling:
Masses were taken from the CAD assembly where geometry and material were defined and estimated where components were not modelled in detail. The arm mass is taken from the Robotics subsystem design, and the payload mass is fixed by specification. A range is reported for each item to capture estimation uncertainty and provide conservative bounds for calculations.
|
Component |
Material |
Qty |
Mass [kg] (min / nom / max) |
|
Main chassis + brackets |
Aluminium 6061-T6 |
1 |
10.3 / 12.8 / 15.4 |
|
Bogie arms |
Aluminium 6061-T6 |
8 |
1.4 / 2.0 / 2.7 |
|
Idler + bogie wheels |
Aluminium 6061-T6 |
10 |
2.2 / 3.2 / 4.3 |
|
Tracks (total) |
Rubber + embedded steel cords |
6m |
4.1 / 6.3 / 9.9 |
|
Sprockets |
Mild steel |
2 |
1.1 / 1.6 / 2.0 |
|
Axles/shafts |
Mild steel |
12 |
1.3 / 1.9 / 2.6 |
|
Motor mounts & steel brackets |
Mild steel |
set |
0.4 / 0.6 / 0.9 |
|
Spring–damper units |
Steel |
8 |
1.3 / 2.0 / 3.1 |
|
Fasteners + washers |
Steel |
40 |
0.3 / 0.4 / 0.8 |
|
Drive motors + gearboxes |
Mixed |
2 |
3.0 / 4.0 / 6.0 |
|
Electronics + wiring (incl. housings/pods) |
ABS/PC + copper |
set |
1.7 / 2.5 / 3.5 |
|
Battery pack |
Li-ion |
1 |
2.5 / 4.0 / 5.5 |
|
Arm assembly |
1 |
11.5 / 11.9 / 12.5 |
|
|
Payload |
1 |
12.8 / 12.8 / 12.8 |
|
|
TOTAL |
53.7 / 66.1 / 82.0 |
||
Figure D1.9 – Estimated mass budget.
D2 Track and suspension layout
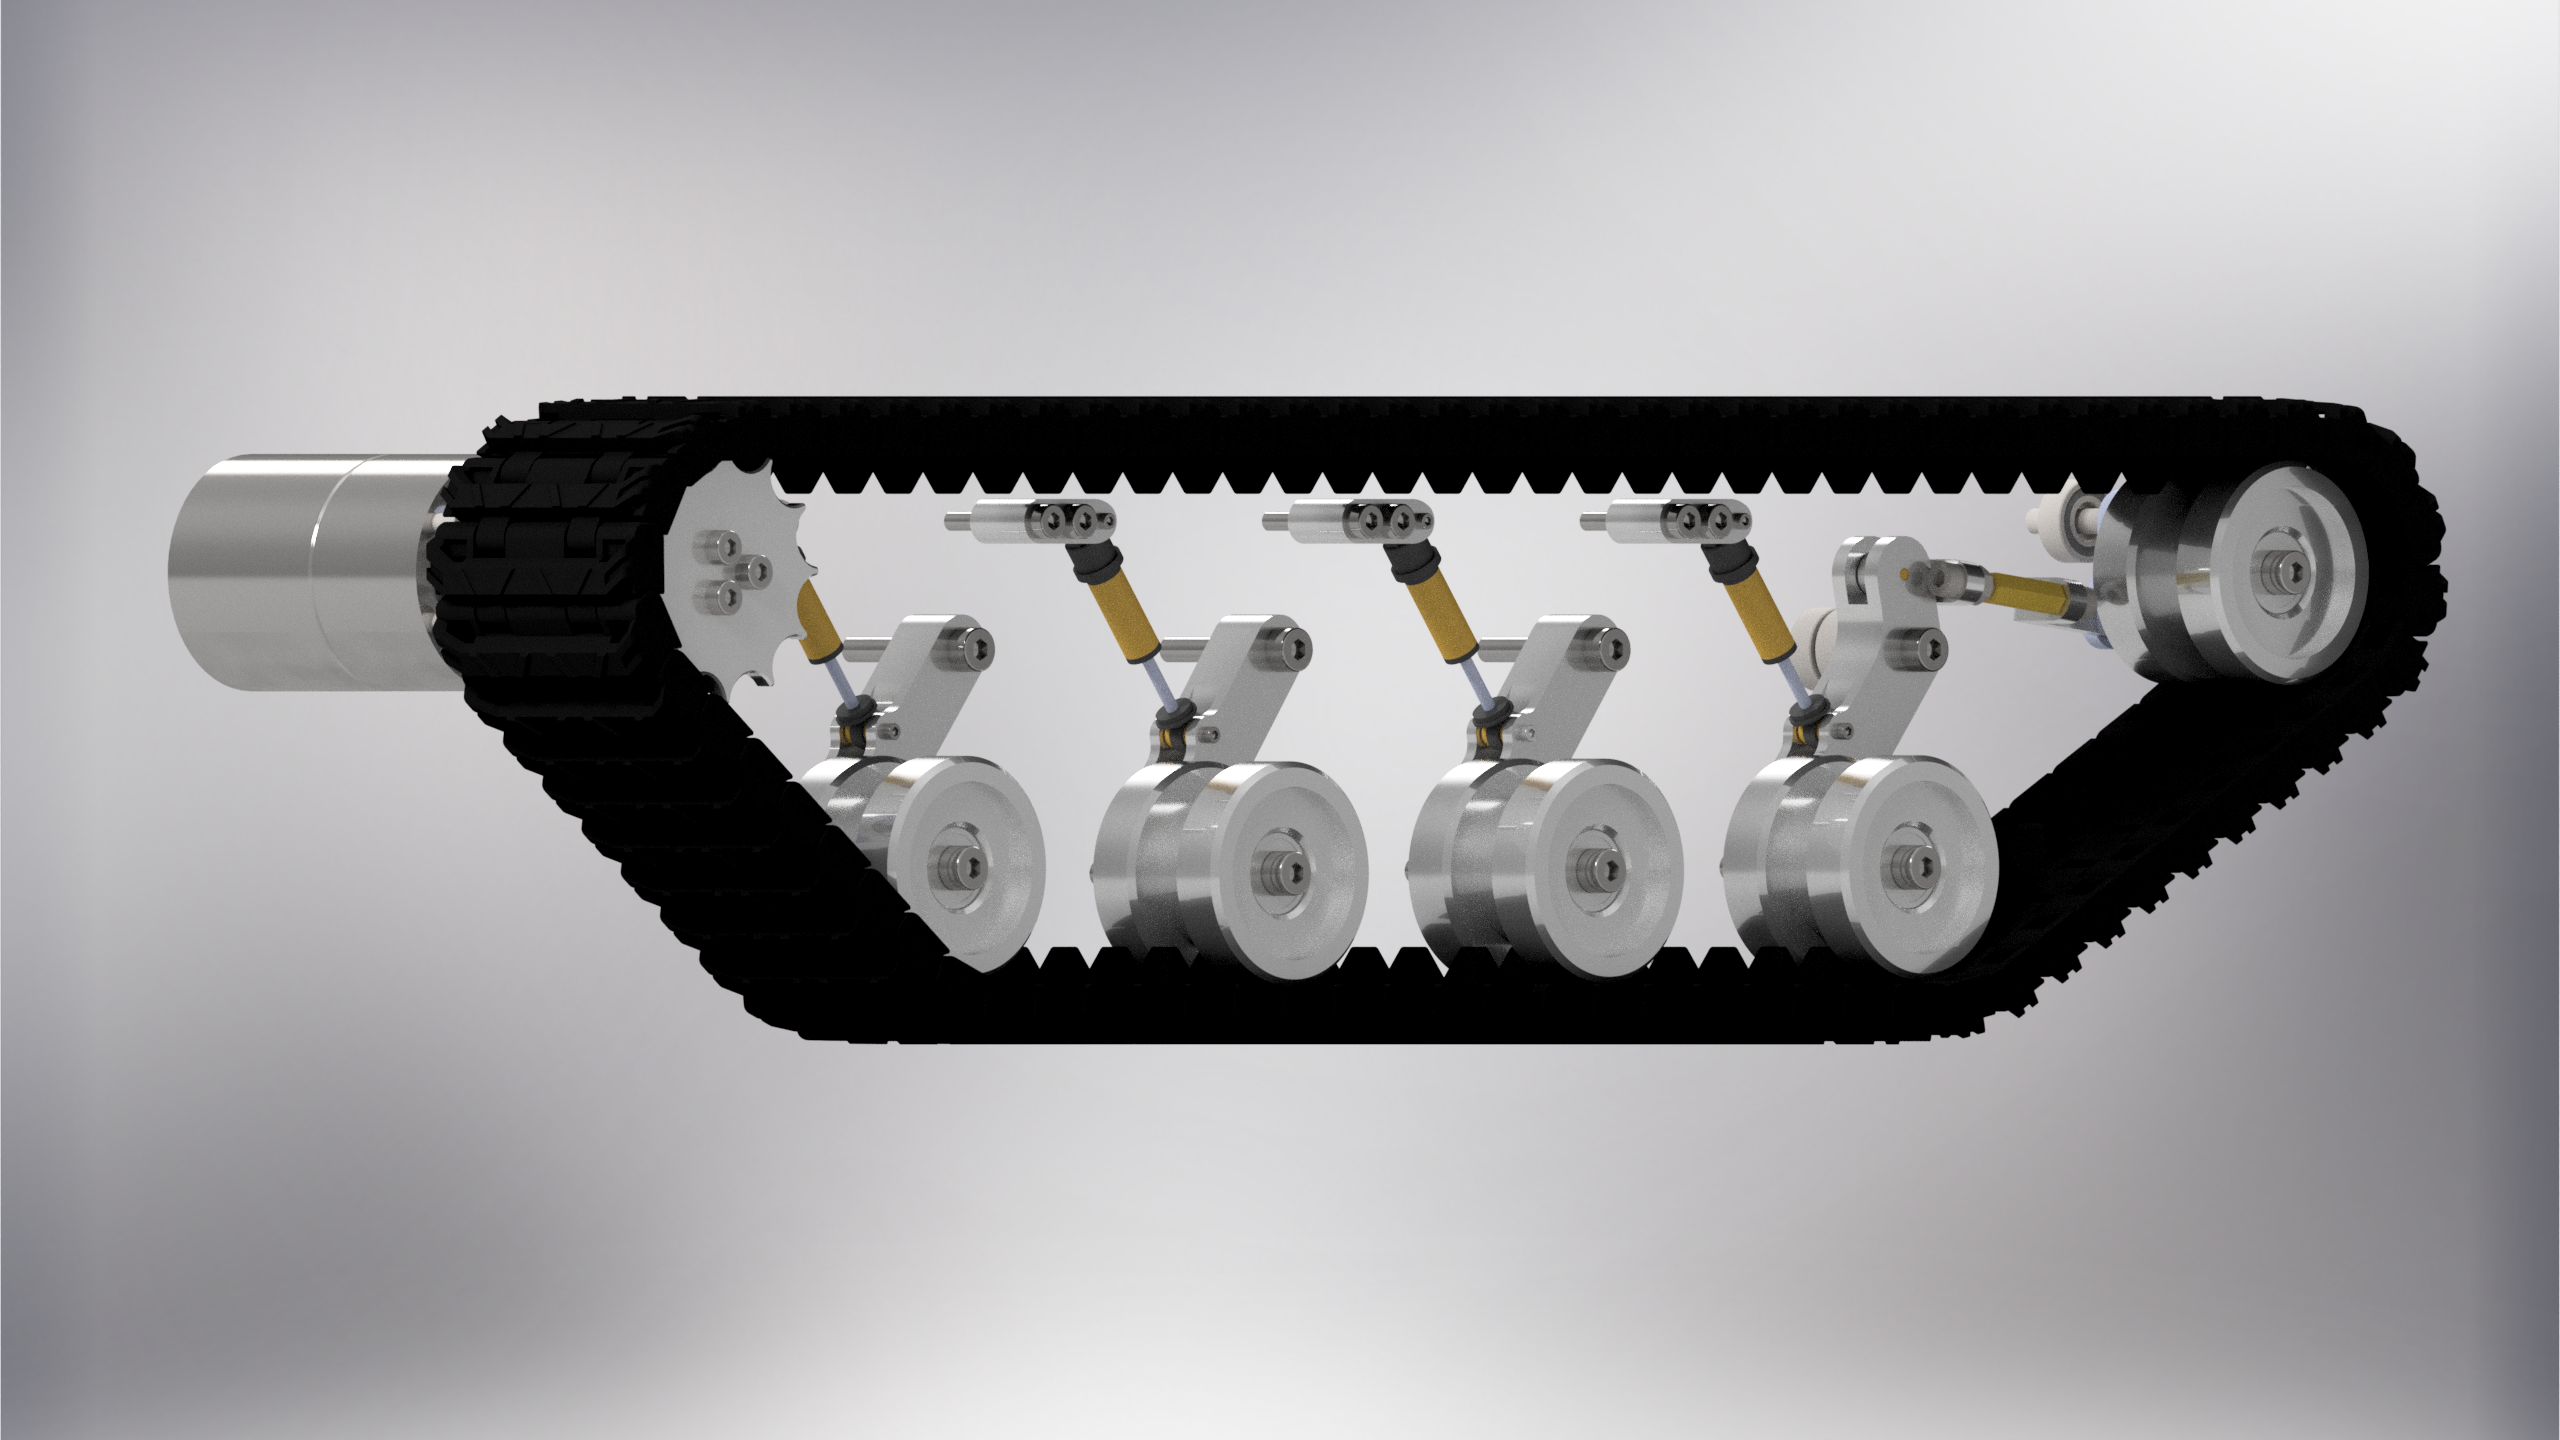
The chassis uses a skid-steer tracked drive system (Figure 2.1) to prioritise traction, stability, and terrain adaptability. Each track is driven by a 24V DC gearmotor acting on the rear sprocket. Rear-mounted drive simplifies packaging and protects the motors from frontal impacts.
The track is supported by a multi-bogie suspension:
- Idlers at the front and rear set track tension and guide engagement over step edges.
- Bogie wheels support the lower track run and distribute ground pressure.
- Spring–damper units on each bogie allow vertical compliance so the track maintains contact over uneven ground, stair edges, and obstacles.
This architecture ensures that traction is preserved during step climbing and arm-induced load transfer.
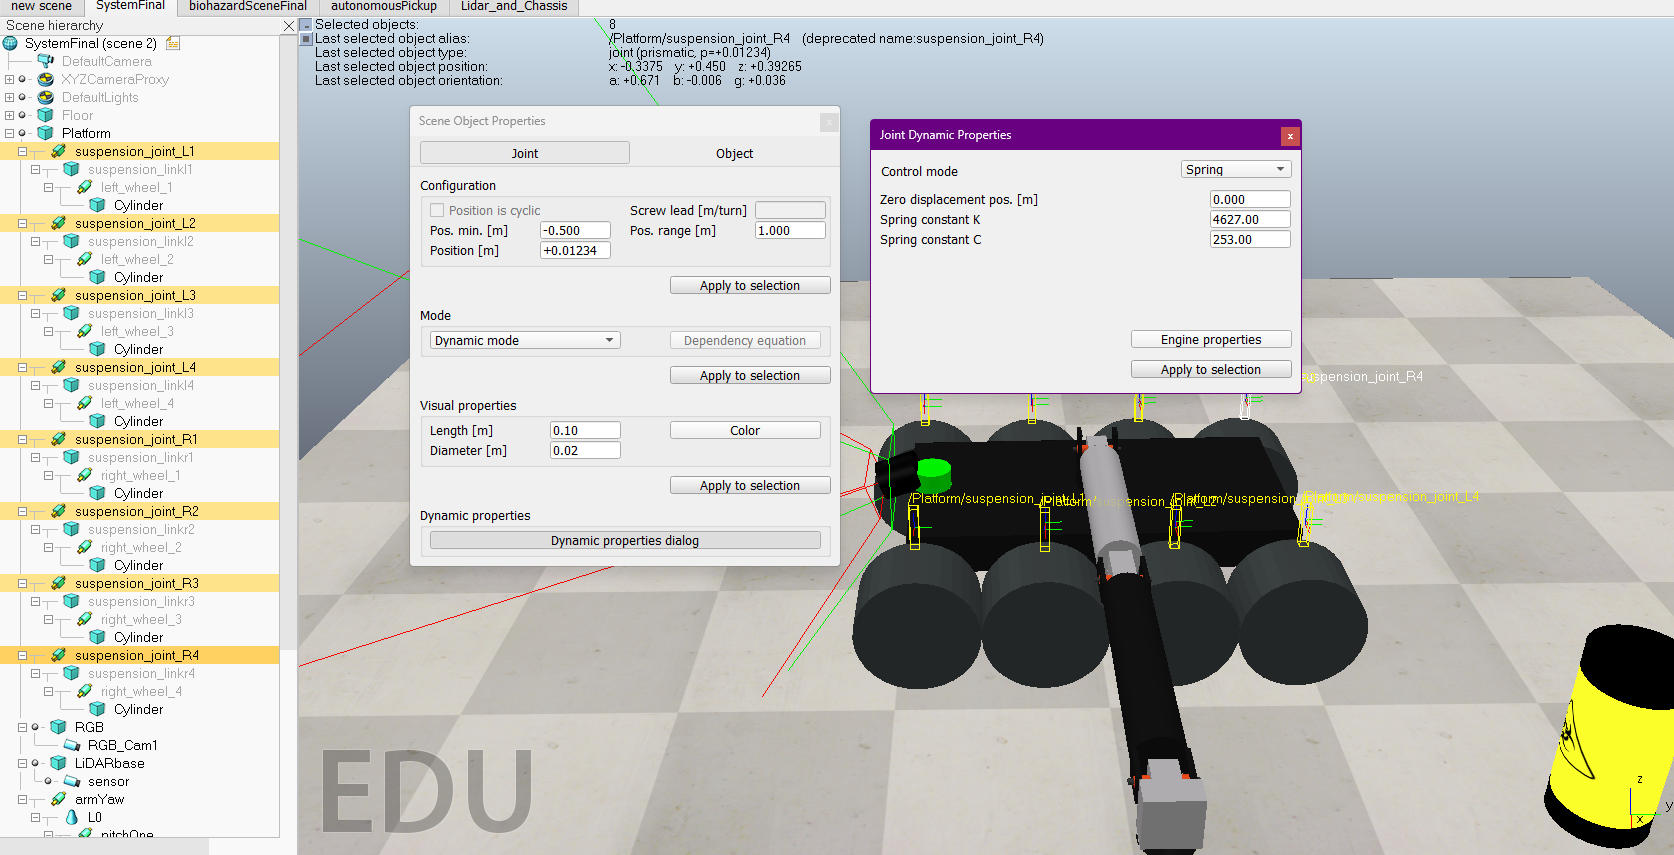
Figure 2.2 – Coppelia wheel simplification and suspension parameters.
In CoppeliaSim, the rubber tracks are approximated via multiple rigid wheel bodies with a vertical damping and spring coefficient (Figure 2.2). This avoids the performance penalty of track links whilst still capturing:
- Normal force distribution
- Longitudinal traction
- Skid steer behaviour
The suspension was sized using a vertical sprung-mass model, with the objective of:
- Limiting chassis heave and pitch oscillations caused by arm motion
- Retaining sufficient compliance to maintain continuous track contact on uneven terrain
The worst-case operating mass (vehicle + payload) was used for sizing, providing a nominal sprung mass of 56.6kg. A target static sag of 15mm was selected. This places the chassis slightly into its travel to reduce dynamic bounce, without sacrificing significant ground clearance. The total stiffness is shared equal across the 8 bogie units, providing a per-bogie stiffness of 4.6kNm-1.
\[ k_{\mathrm{total}}=\frac{m_{\mathrm{sprung}}\,g}{\delta_{\mathrm{sag}}} \]
\[ k_{\mathrm{each}}=\frac{k_{\mathrm{total}}}{8}=4627~\mathrm{kN/m} \]
Full calculation in Appendix M9.
Damping was selected using a target damping ratio of \( \zeta=0.7 \), to produce a well-damped second-order response that mitigates oscillations without overdamping.
\[ c_{\mathrm{tot}}=2\zeta\sqrt{K_{\mathrm{tot}}\,m_s} \]\[ c_i=\frac{c_{\mathrm{tot}}}{N} \]
\[ c_{\mathrm{bogie}}=\frac{c_{\mathrm{tot}}}{4}=253~\mathrm{N\,s/m} \]
In CoppeliaSim, each of the 8 wheels representing a bogie shares the equivalent stiffness and damping.
D3 Drive motors and gearing
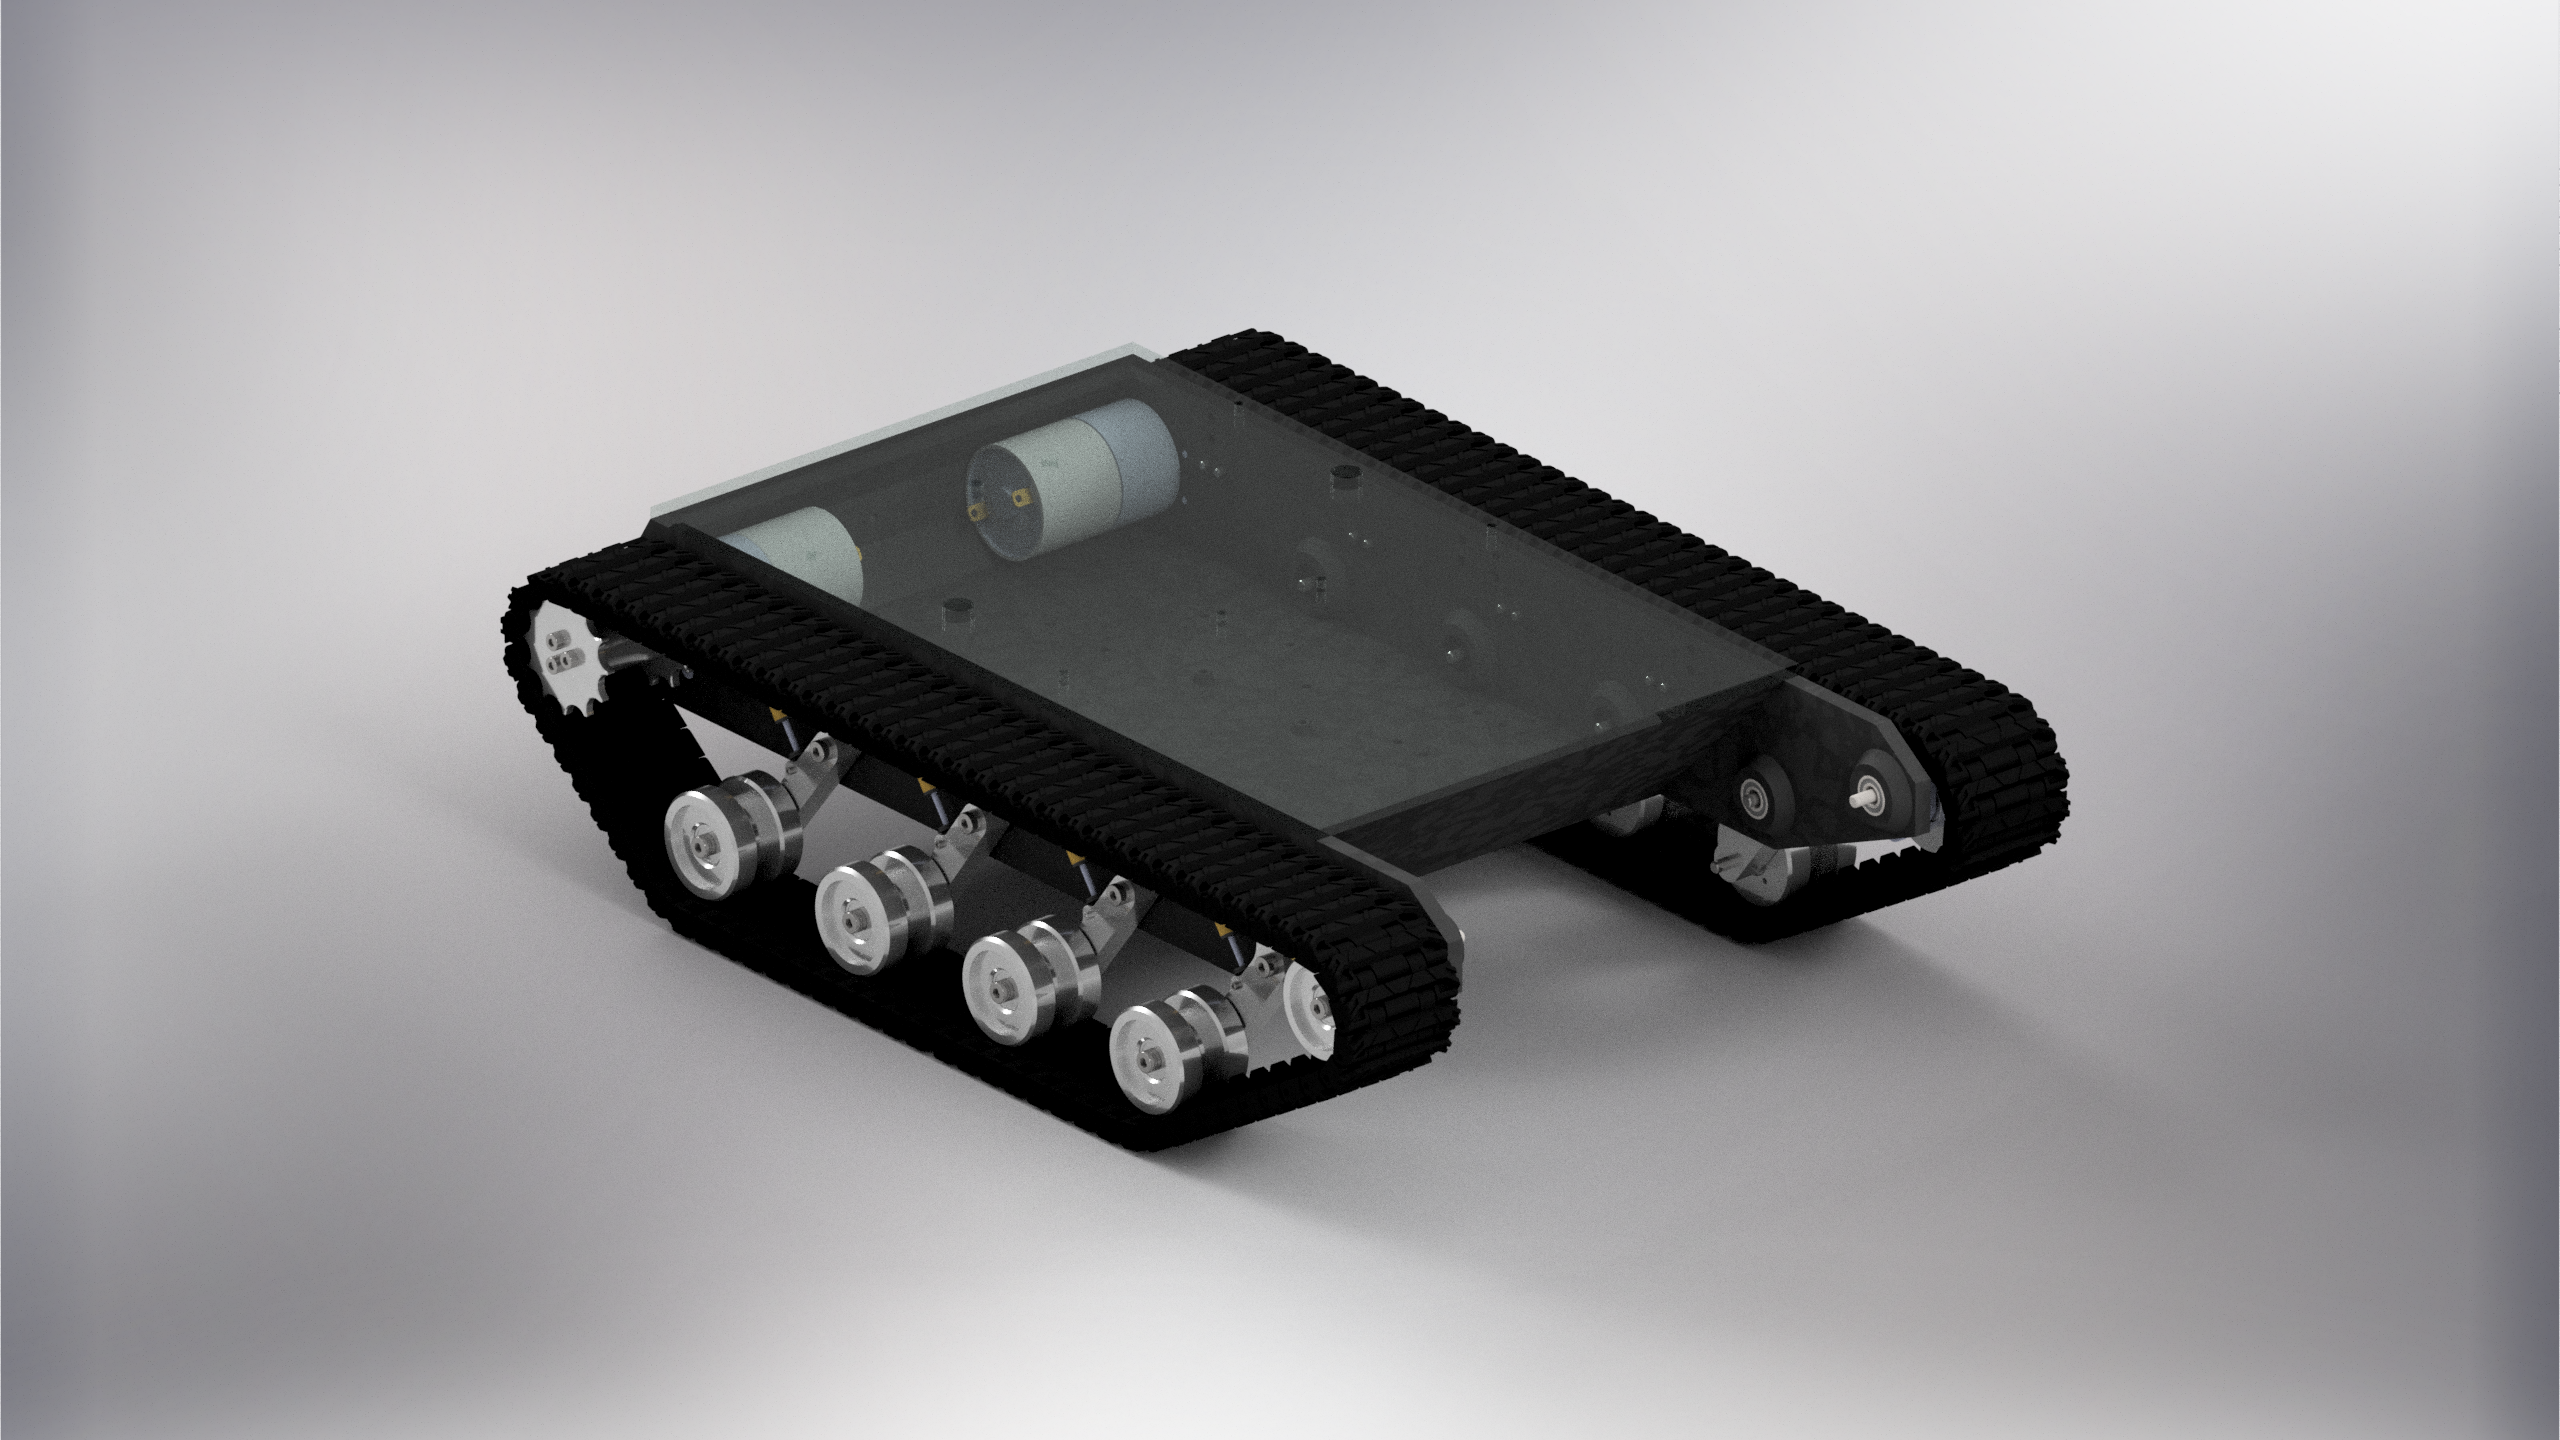
Figure D3.1 – Rear motor driven tracks.
This section defines the tracked drive actuation based on the mobility requirements M01, M06 and M07. Detailed calculations are provided in Appendix M4 and M5.
Design load cases and requirements:
The drive system is chosen based on the worst-case operating condition:
- Maximum vehicle mass including payload (82kg)
- Contant ascent on a 10% gradient
- Pull-away from rest on the incline
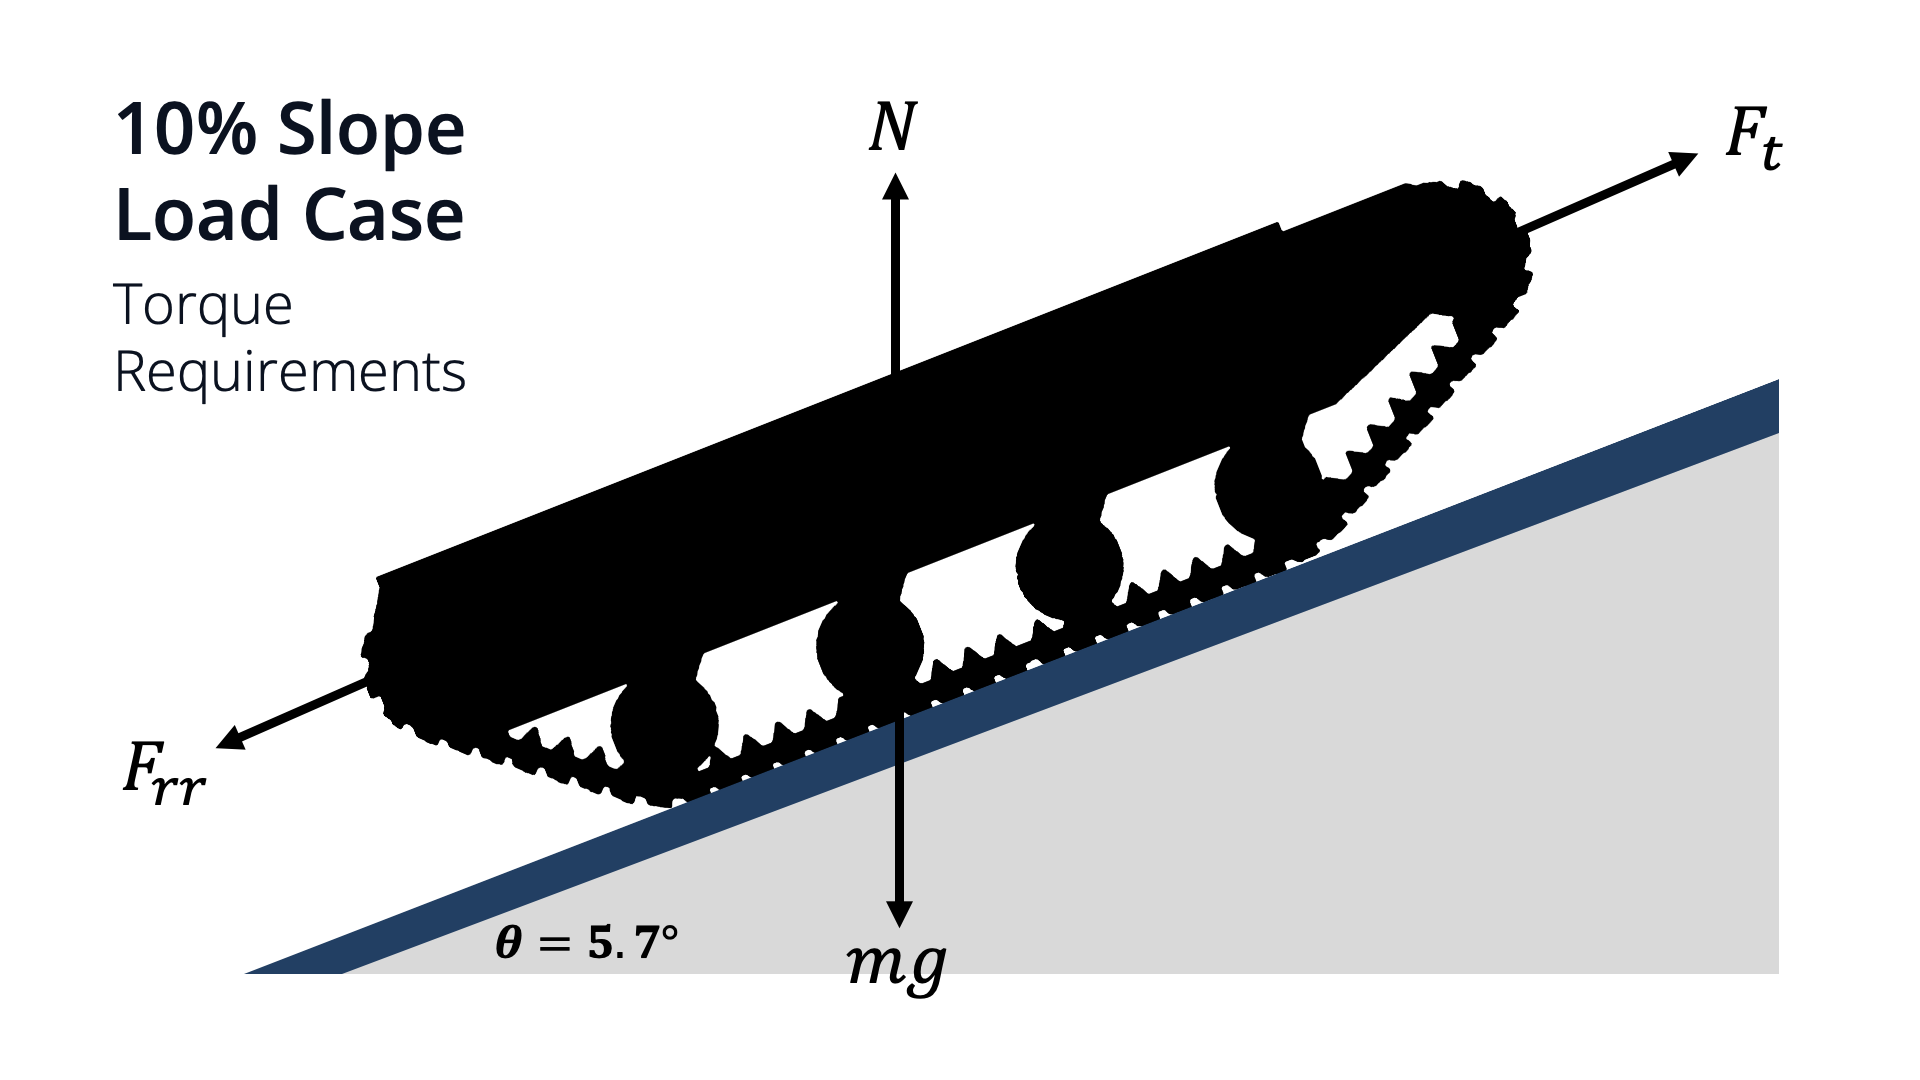
Figure D3.2 – Slope ascent free body diagram.
\[ F_{\mathrm{req}} = mg\left(\sin\theta + C_{rr}\cos\theta\right) + ma \]
The free body diagram (Figure D3.2) provides the required tractive force, which is distributed between the 2 tracks. The results sprocket torque per track required is:
- 3Nm for steady uphill motion
- 4Nm for uphill pull-away
The system velocity requirement allows us to derive required motor speeds:
- Cruise speed target: 1.5m/s, motor speed required = 286rpm
- Maximum speed target: 2.5m/s, motor speed required = 478rpm
Motor and gearbox selection
A 24V MY1020Z 500W DC gearmotor with a 6.67:1 planetary gearbox is selected for each track. Key characteristics at the output shaft are:
- Rated torque = 8.5Nm
- Rated speed = 500rpm
This provides:
- 2× torque margin over the design requirement (M01, M06)
- Sufficient speed to meet the maximum velocity target 2.5 m/s (M07)
The selected margin accounts for unmodelled losses such as track compliance, bearing friction, and terrain variability.
Implementation in CoppeliaSim
To ensure representative behaviour, the motor selection is enforced in CoppeliaSim by applying joint-level torque and speed limits consistent with the selected hardware. Verification is carried out by logging motor torque and speed during representative manoeuvres and confirming compliance.
D4 Electrical powertrain and energy budget
This section defines the 24V electrical architecture, including battery selection, motor drivers, and power distribution for the tracked base and manipulator. Electrical sizing is driven by a mission-level Simulink power model, which is parameterised using motor speed and torque demands extracted from a full biohazard recovery scenario in CoppeliaSim.
This methodology ensures that peak currents, thermal loading, and energy capacity are derived from representative operational use.
D4.1 Power architecture and 24V DC bus
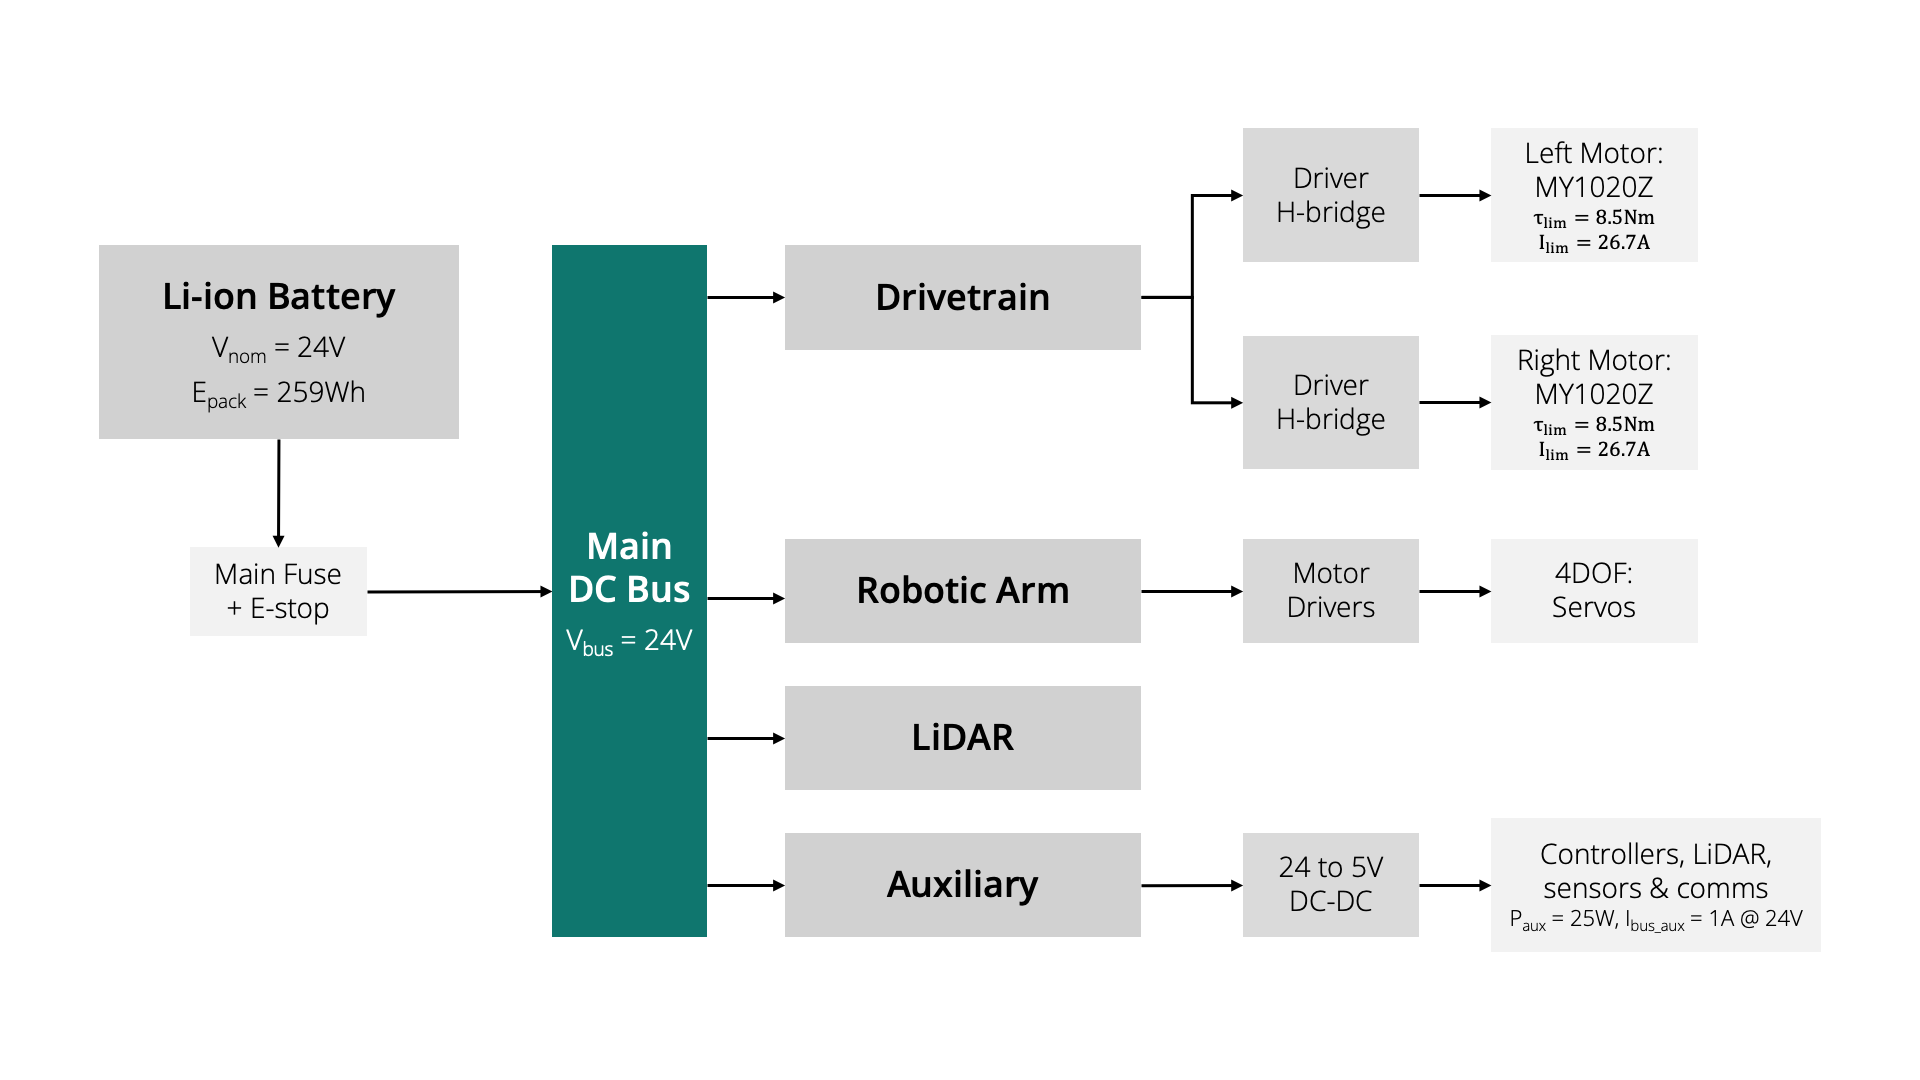
Figure D4.1 – 24V power architecture and load branches.
Power is distributed from a single 24V DC bus supplied by a 7s2p Li-ion traction pack of nominal capacity 10Ah (259Wh). The pack includes and integrated BMS and is protected by a main fuse and emergency-stop switch, providing a primary electrical protection boundary.
A 24V bus feeds three branches from the battery:
- Dual H-bridge drivers for the left and right track motors
- Shared arm-drive bus for the joint actuators
- 24V LiDAR
- 5V DC-DC converter to supply sensing, microcontrollers and communications
This bus voltage was selected to match the MY1020Z tracked drive and arm motors (Appendix M5, M6) whilst keeping bus current significantly lower than a 12V system for the equivalent power. This decision minimises cable losses and keeps continuous current demand within the battery’s 20A continuous / 60A peak discharge ratings.
Bus voltage, current and cumulative energy were monitored at the 24V node in the Simulink model, so that endurance and current-rating requirements (M07-M10) can be verified.
D4.2 Motor drivers and electrical demands
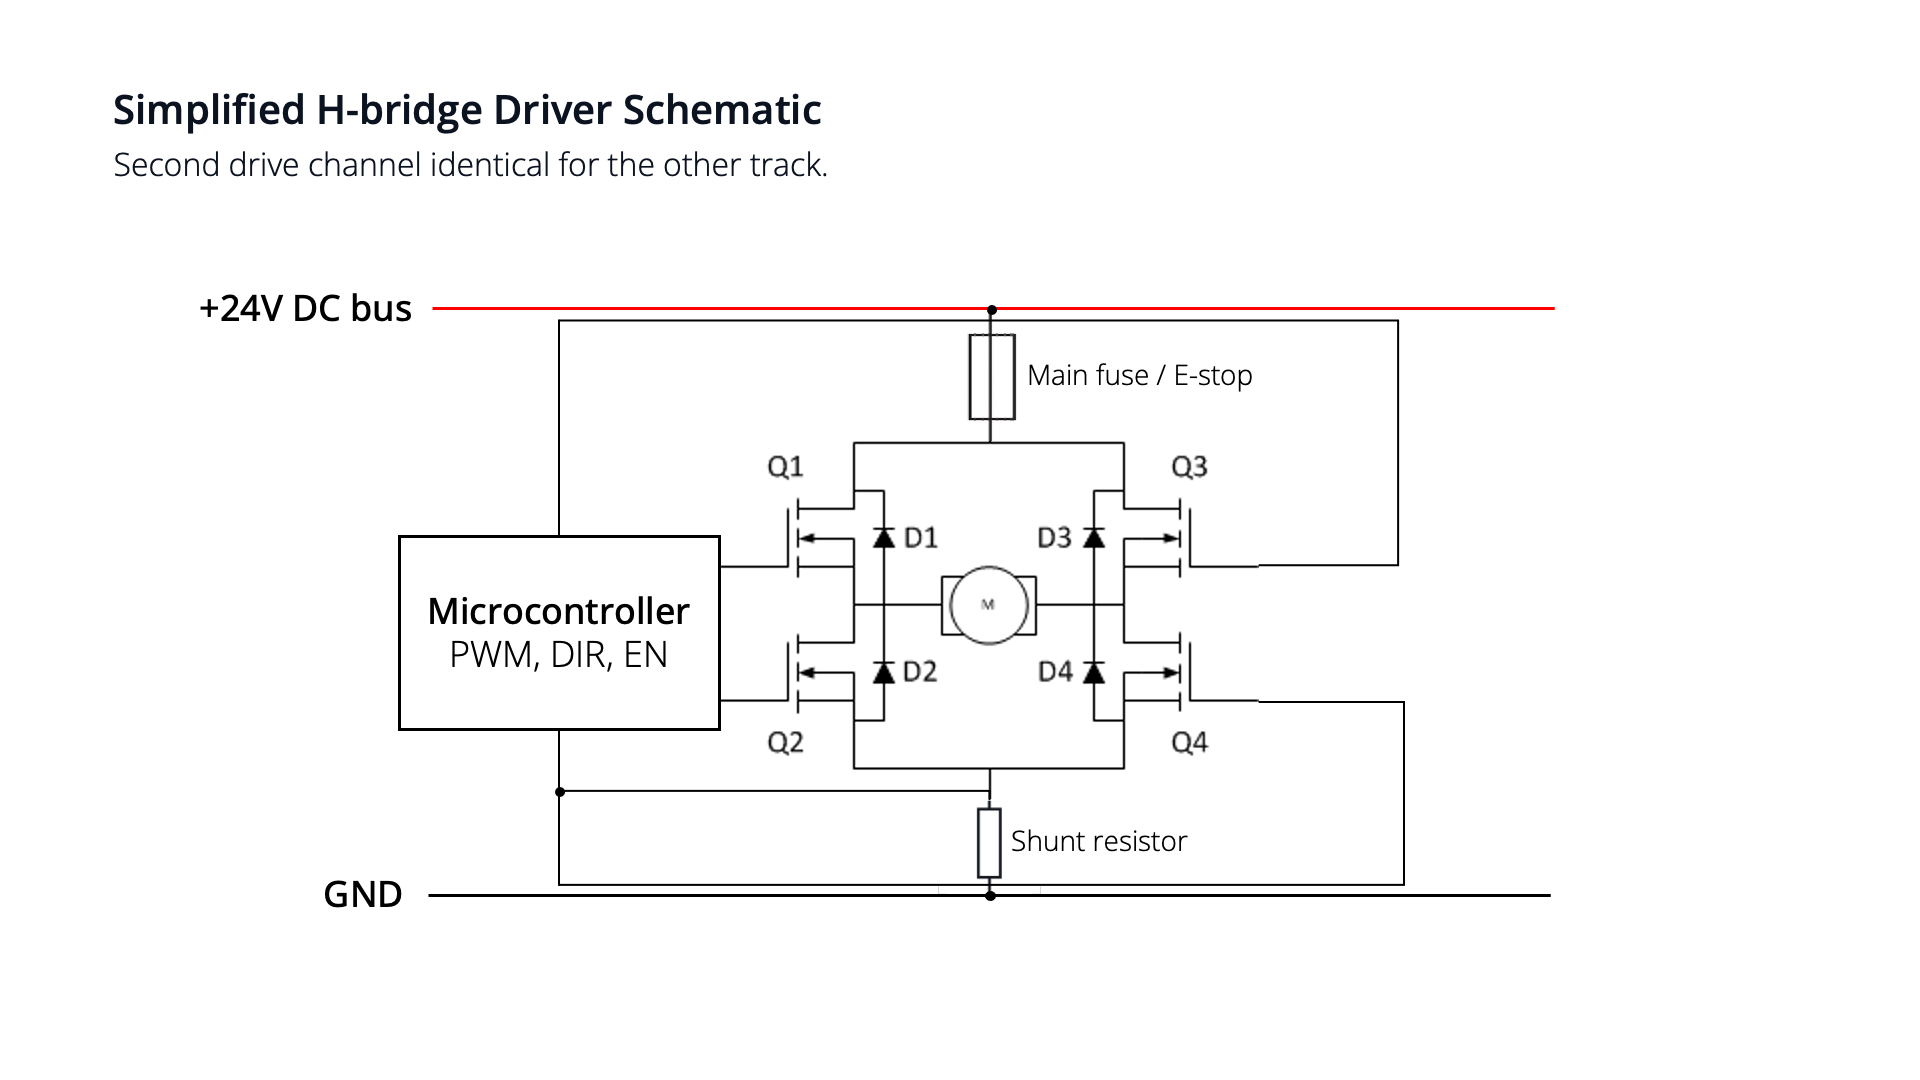
Figure D4.2 – Simplified 24 V H-bridge schematic for one track motor.
Track driver sizing is derived from the motor torque and speed requirements discussed in Section D3: a required sprocket torque of 4 Nm per track for slope climb and 3Nm for holding:
- For the 2 cases, the sprocket speed targets are converted to angular velocity and mechanical power is computed as \[ P_{\mathrm{mech}}=\tau\,\omega \]
- Assuming a combined motor–gearbox–driver efficiency of , the corresponding electrical power and 24 V bus current are obtained from \[ P_{\mathrm{elec}}=\frac{P_{\mathrm{mech}}}{\eta} \]\[ I_{\mathrm{bus}}=\frac{P_{\mathrm{elec}}}{V_{\mathrm{bus}}} \]
- The resulting continuous and peak currents per track are summarised in Figure D4.3, with full arithmetic provided in Appendix M4.
The selected H-bridge driver is rated for ≥30V and ≥32A continuous (≥64A peak), exceeding the calculated electrical demand and the motor datasheet limits (26.7A rated, 53A peak) with ≥20% margin. In combination with the 24V battery, the electrical architecture can supply the required pull-away and holding torques within safe duty-cycle limits.
|
Quantity |
Value |
|
Vmotor |
24V |
|
Icont |
6.25A |
|
Irated |
26.7A |
|
Ipeak |
53A |
|
Driver Vmax |
30V nominal (33.6V absolute) |
|
Driver Imax |
32A/64A |
|
Margin (driver/demand) |
1.2x |
Figure D4.3 – Track motor and driver specifications.
D4.2 Motor drivers and electrical demands
A discrete-time Simulink power model was developed for mission energy budgeting and battery sizing.
Rather than assuming actuator loads, the model is driven by joint torque and speed data recorded during the full biohazard recovery mission (in CoppeliaSim). This data is processed in MATLAB and imported via a structured bus, ensuring the power model is traceable to the validated dynamic simulation.
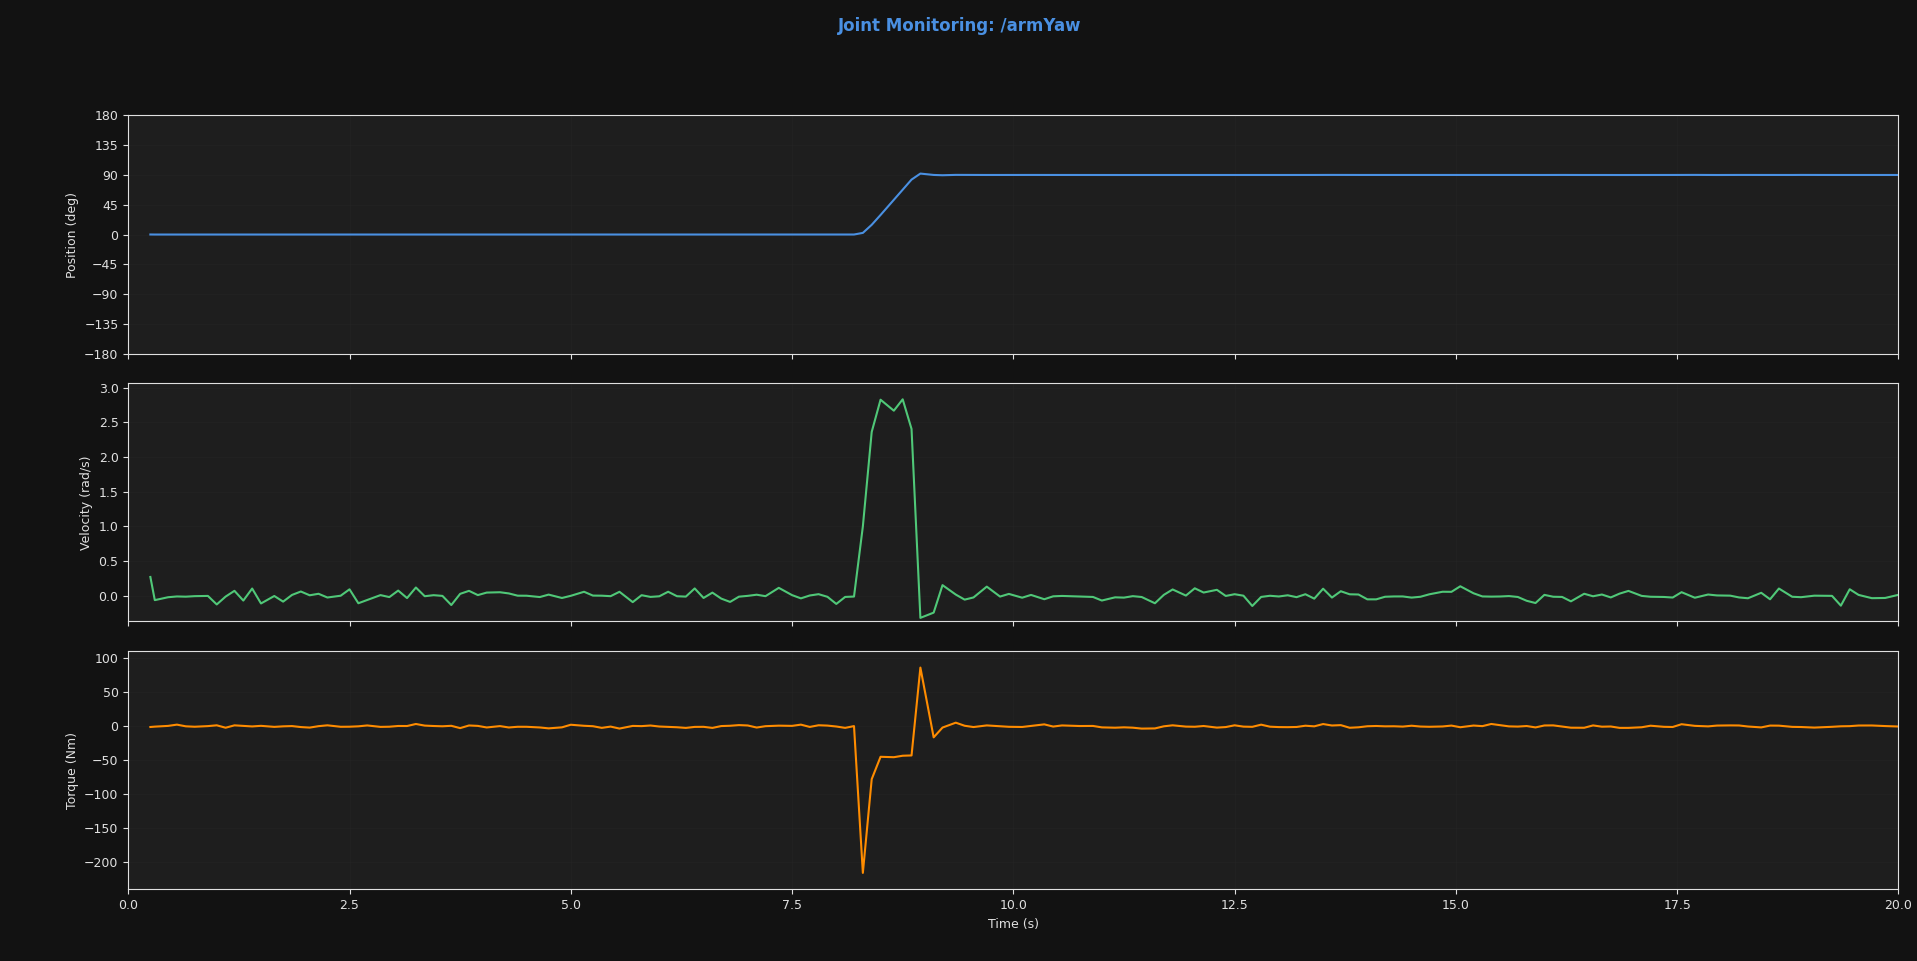
Figure D4.4 – Example yaw joint data logged from CoppeliaSim for 0-90 step.
Robotic arm motor selection
The yaw, shoulder and elbow joints are modelled as 750W, 24V servo actuators with gearbox reductions of 80:1, 120:1 and 80:1 respectively, while the wrist joint is modelled as a smaller 24V BLDC actuator (Appendix M6)
Gearbox ratios and motor ratings were chosen to exceed the peak torques provided by the Robotics Section structural model and are used to parameterise current and power limits in the Simulink energy model.
Simulink power model design
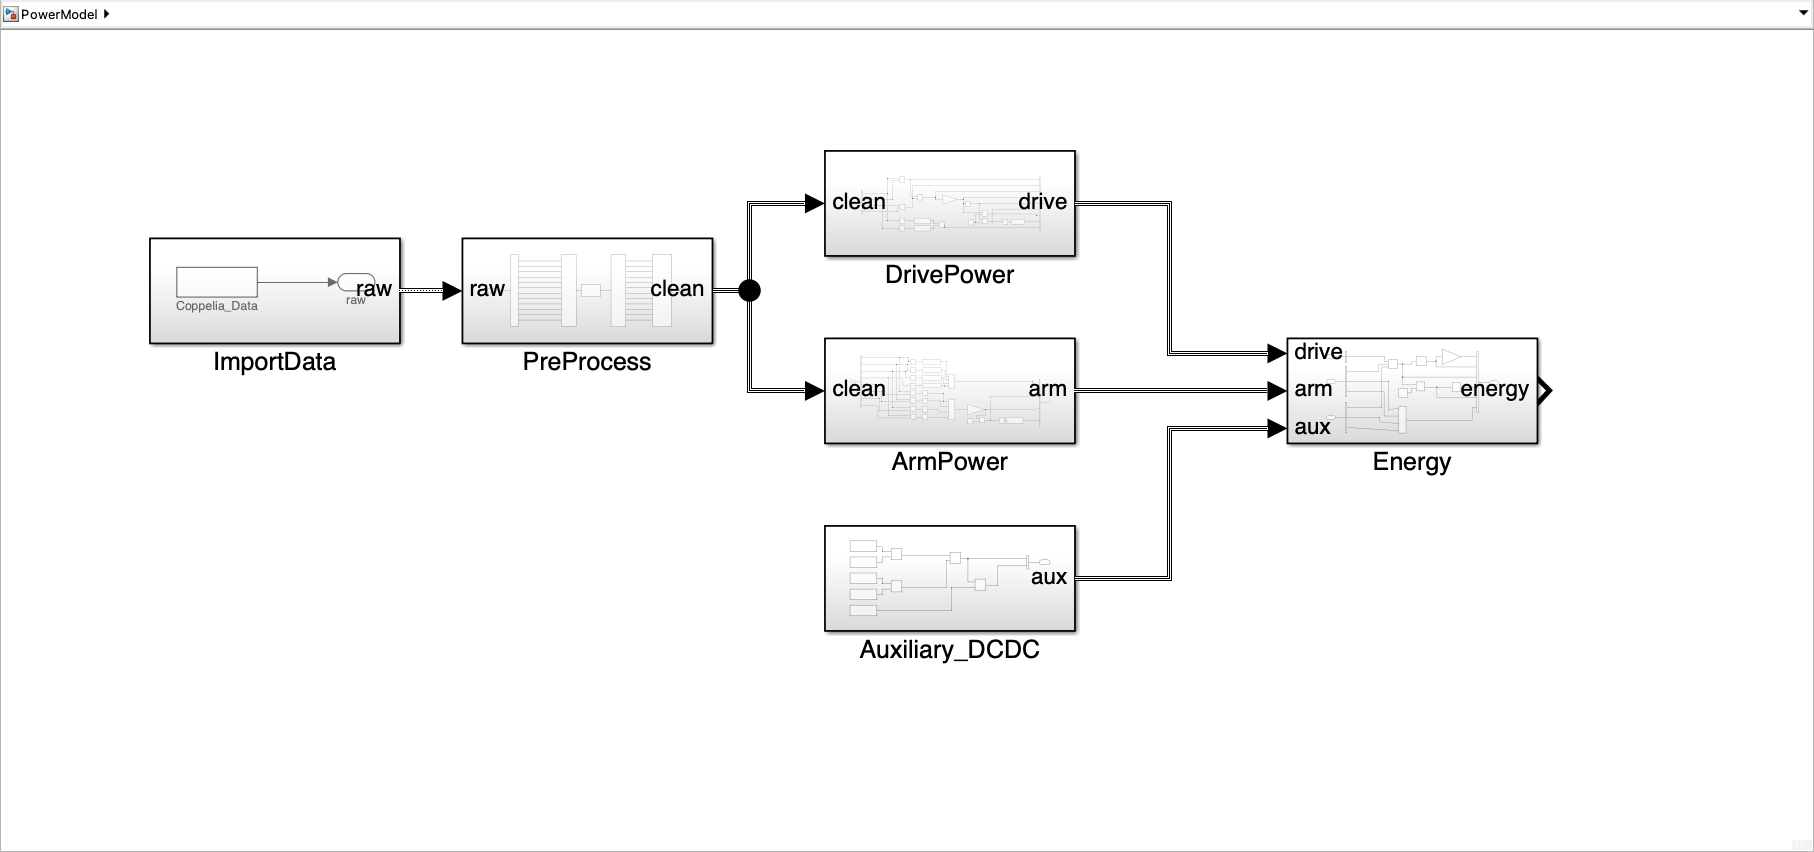
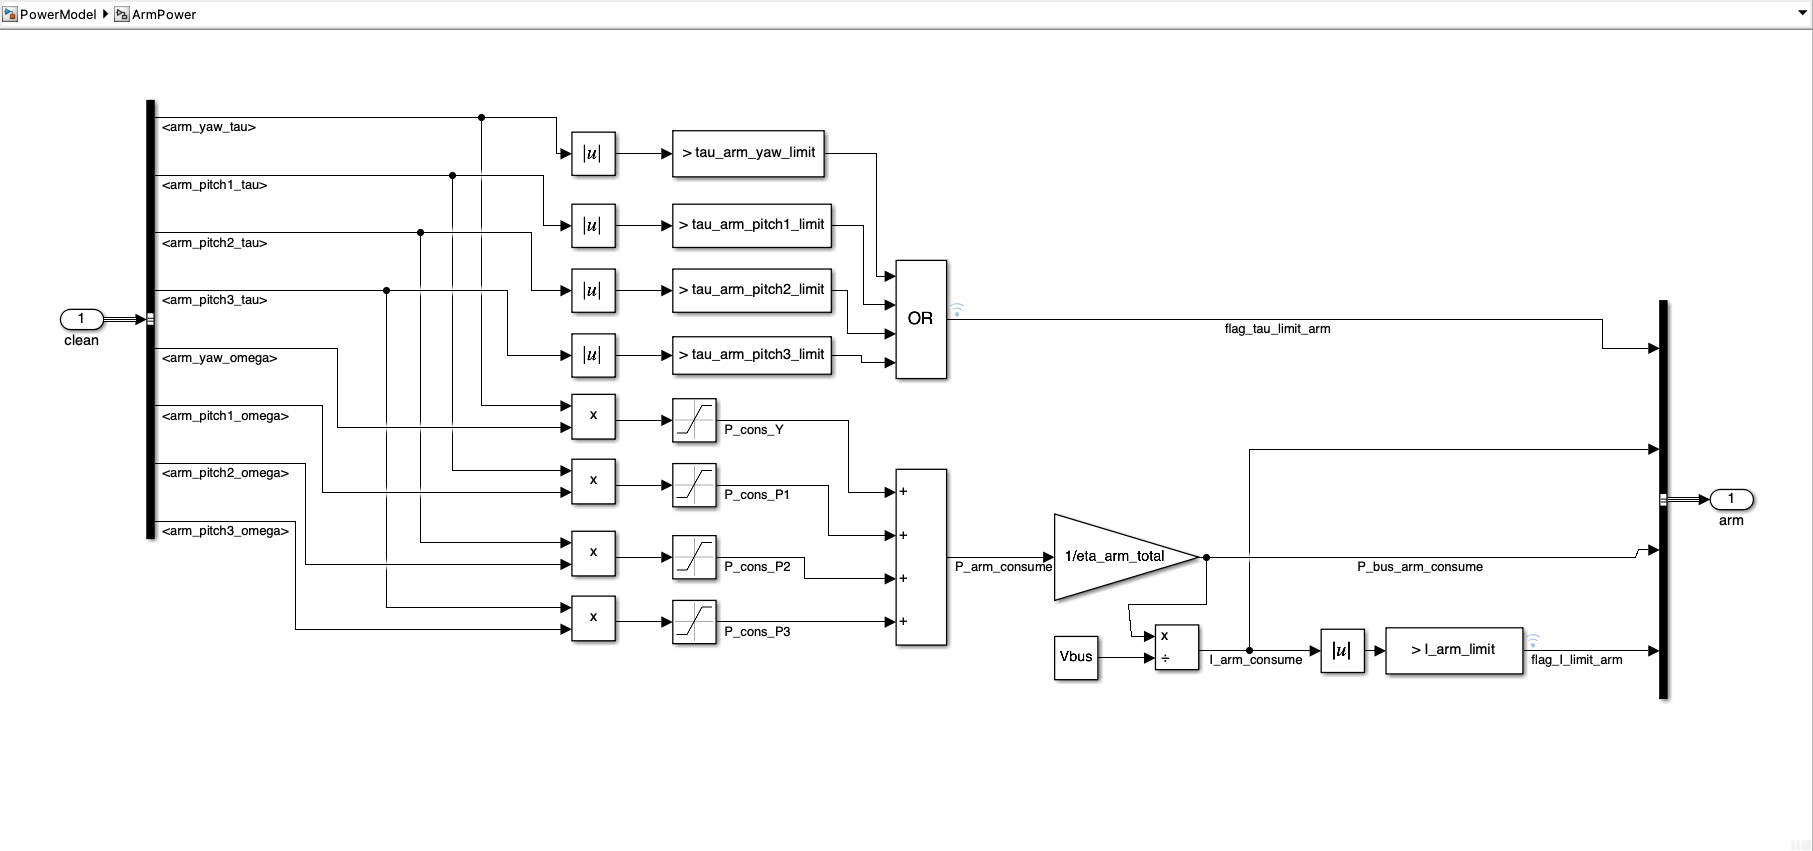
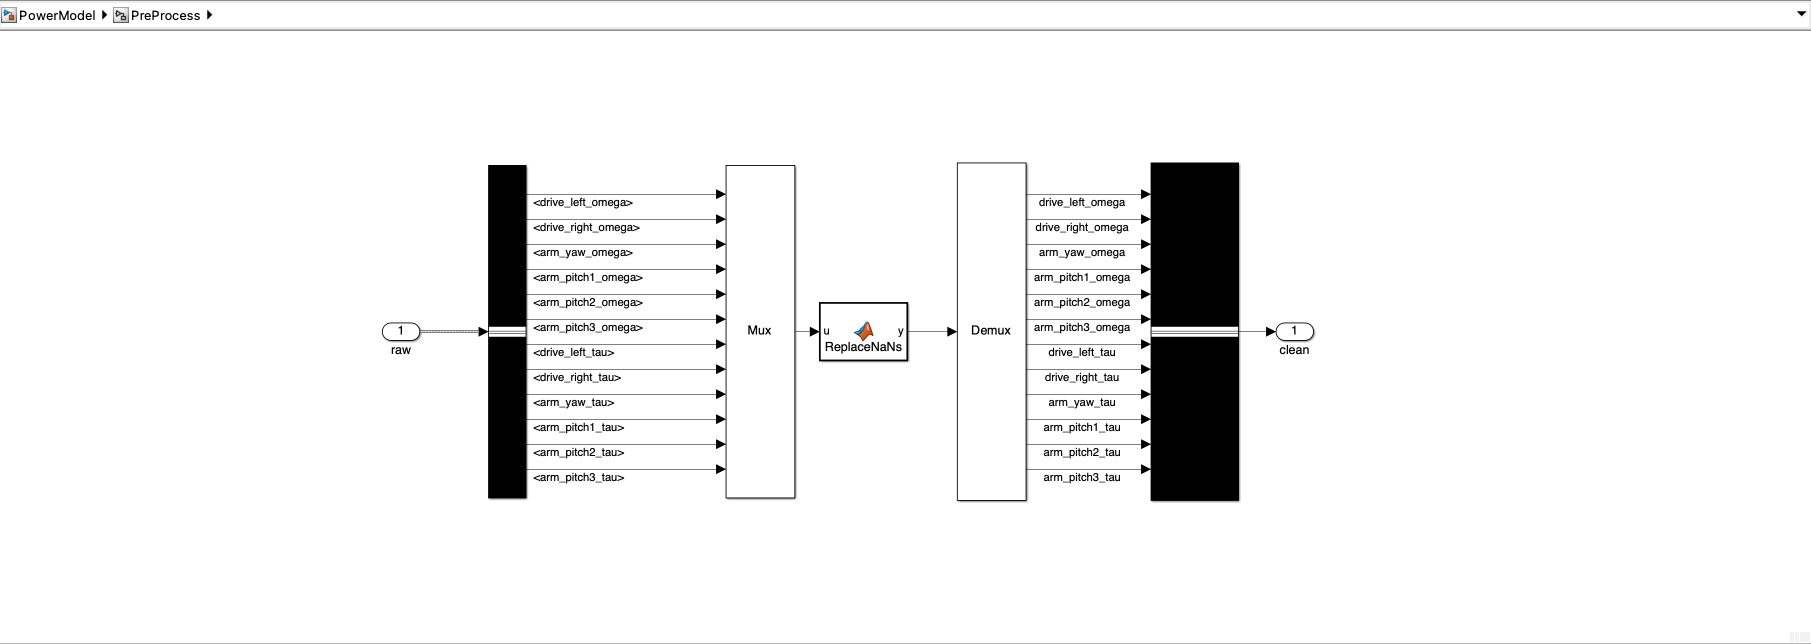
Figure D4.5 – Full Simulink power model. Detailed picture of each subsystem in Appendix M12.
The Simulink power model (Figure D4.5) is organised into modular subsystems, namely:
- Data import
- Preprocessing
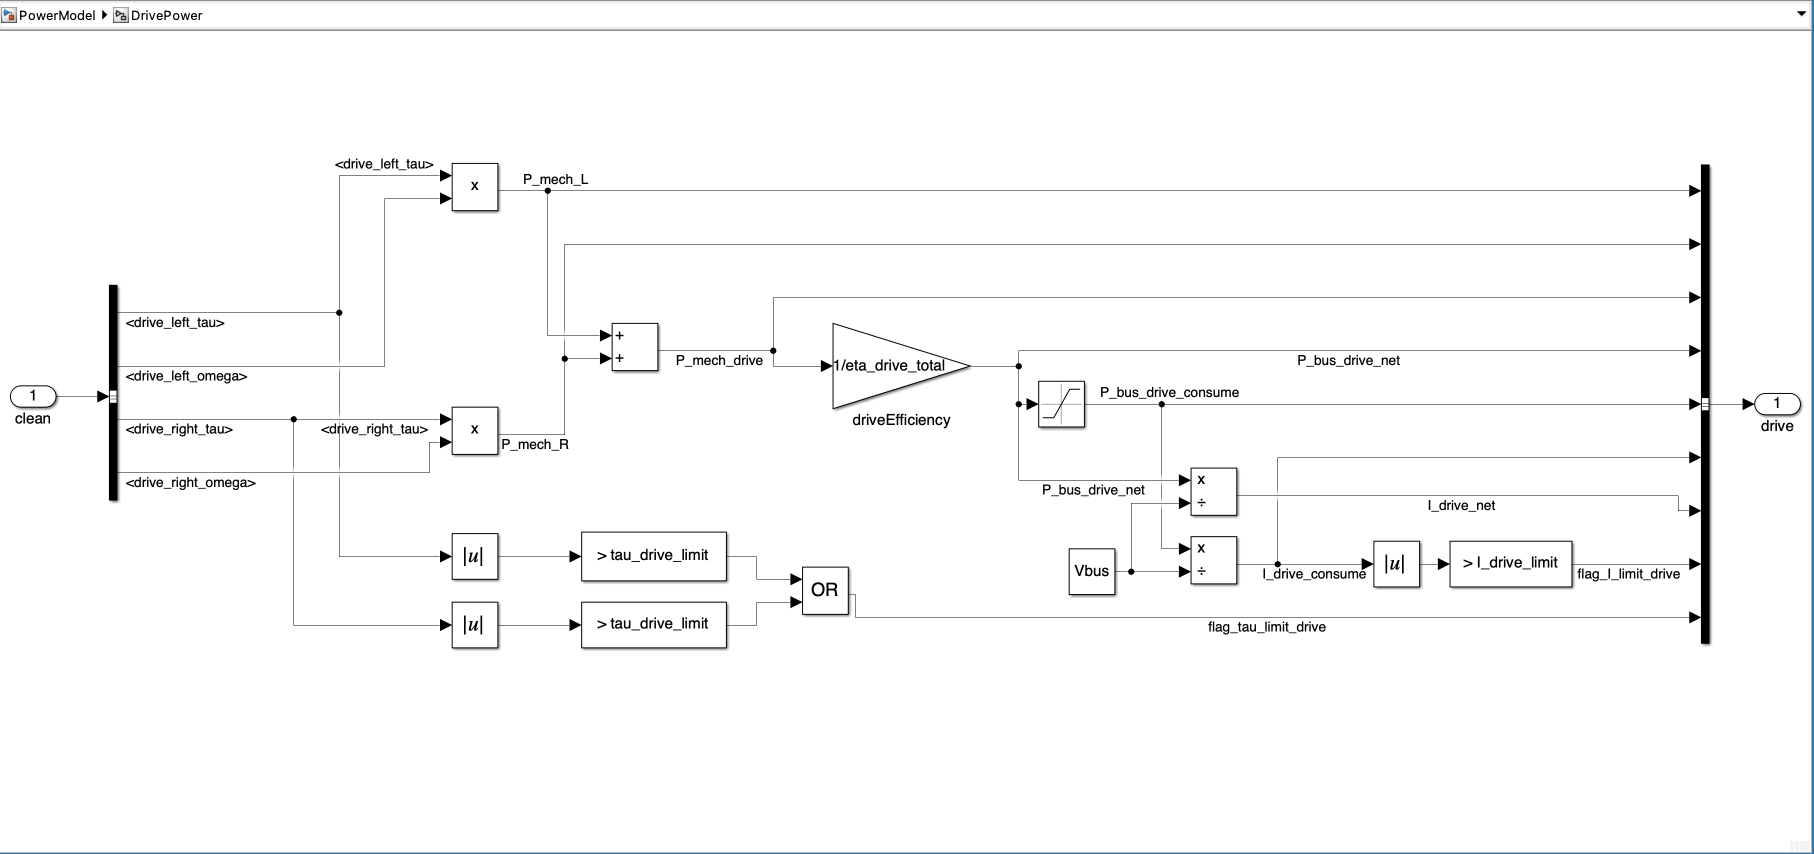
- Drivetrain
- Robotic arm
- Auxiliary loads
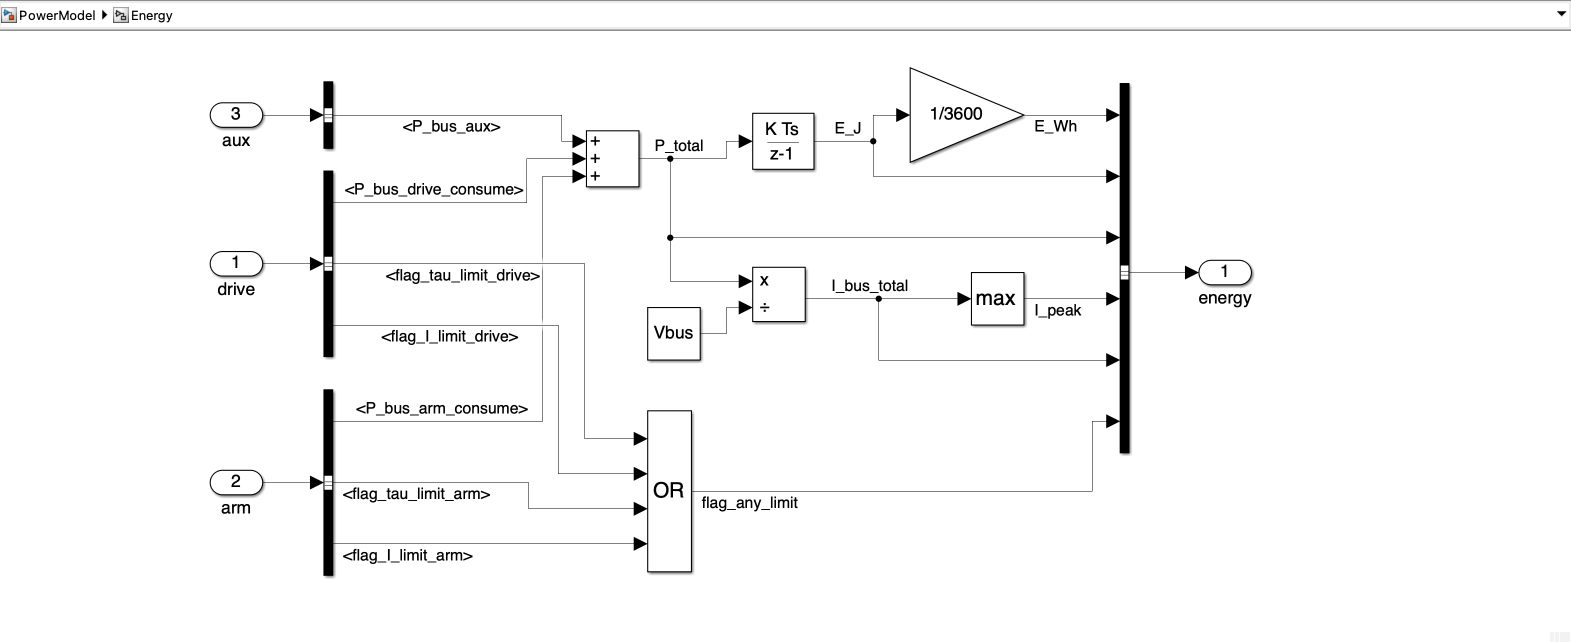
- Energy integration
Power computation procedure:
1) Data alignment and sign convention
Logged motor torque and angular velocity data are aligned to a common time base and mapped to a consistent sign convention such that motoring operation produces positive mechanical power.
2) Mechanical power calculation
Mechanical power is computed per actuator as
\[ P_{\mathrm{mech},i}(t)=\tau_i(t)\,\omega_i(t) \]
3) Consumed power definition
To prevent cancellation during reversing, turning or back-driving, only consumed power is accumulated:
\[ P_{\mathrm{cons},i}(t)=\max\!\left(P_{\mathrm{mech},i}(t),\,0\right) \]
4) Efficiency mapping to DC bus
Lumped efficiency factors convert consumed mechanical power to equivalent DC-bus power, using representative values for the tracked drivetrain and arm actuators consistent with the sizing assumptions.
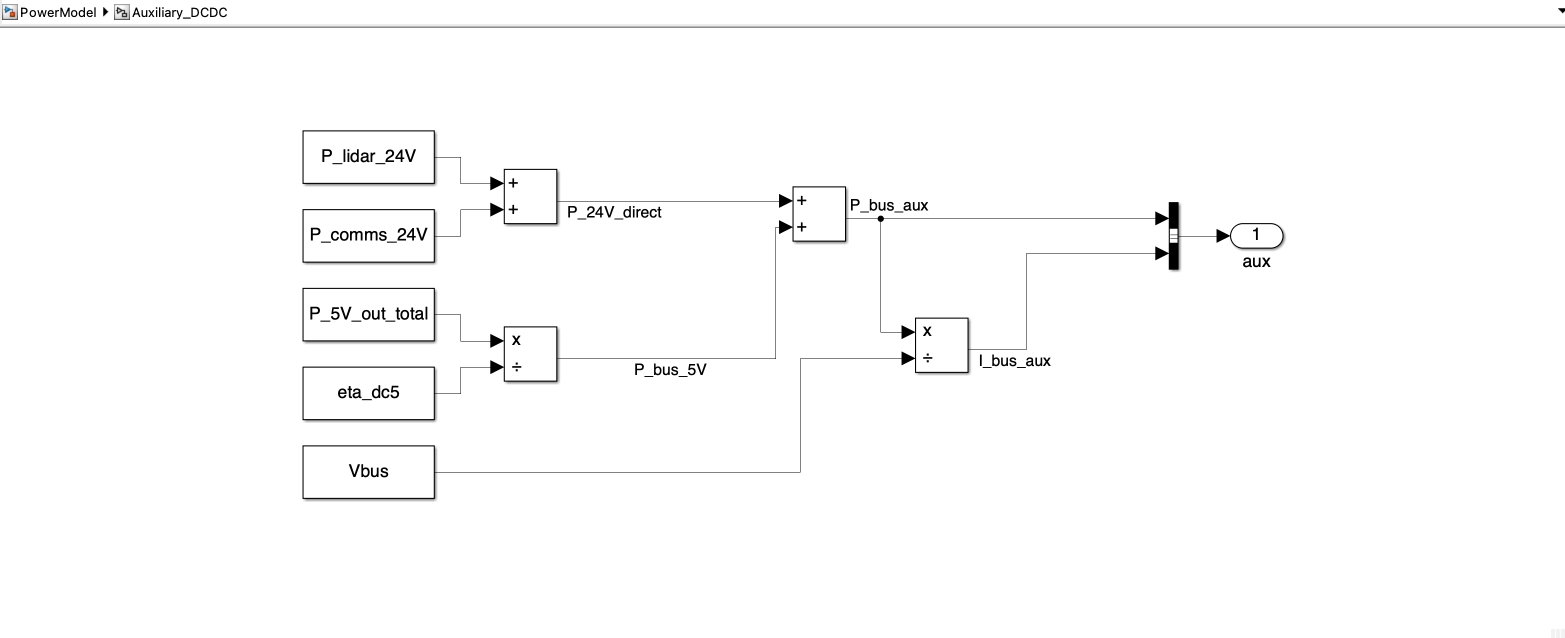
5) Auxiliary electrical loads
Auxiliary loads (LiDAR, compute, cameras, IMUs and communications) are modelled as a parallel branch on the 24 V DC bus. Devices operating at lower voltages are mapped using a DC–DC conversion efficiency \(\eta_{\mathrm{dc}}=0.9\), with: \[ P_{\mathrm{bus}}=\frac{P_{\mathrm{out}}}{\eta_{\mathrm{dc}}} \]
Auxiliary power estimates are taken from manufacturer datasheets where available and otherwise conservatively bounded (Appendix M7).
6) Bus power, energy and current
Total DC-bus power is obtained by summing drivetrain, arm and auxiliary contributions. Mission energy is computed by discrete-time integration,
\[ E_{\mathrm{Wh}}=\frac{1}{3600}\int_{t_0}^{t_f} P_{\mathrm{bus}}(t)\,dt \] and bus current is evaluated as \[ I_{\mathrm{bus}}(t)=\frac{P_{\mathrm{bus}}(t)}{V_{\mathrm{bus}}} \]
7) Limit enforcement
Automated limit checks flag any torque or current exceedances, preventing unrealistically optimistic performance in accordance with requirements M09 and M11.
Battery sizing outcome and design decision:
Executing the full 10-container mission yields a total energy demand of 21Wh (Figure D4.6).
Therefore, the selected 24V Li-ion battery pack provides substantial energy margin, enabling multiple complete missions per charge. The simulated peak bus current (15.7A) remains comfortably below the 20A continuous discharge rating. (Figure D4.7)
The battery mass of 1.2kg remains within the 4 kg allowance assumed in chassis mass budget, so no mechanical re-iteration is required. Detailed power, current and energy traces used to satisfy the requirements are presented in Section E (Test Results).
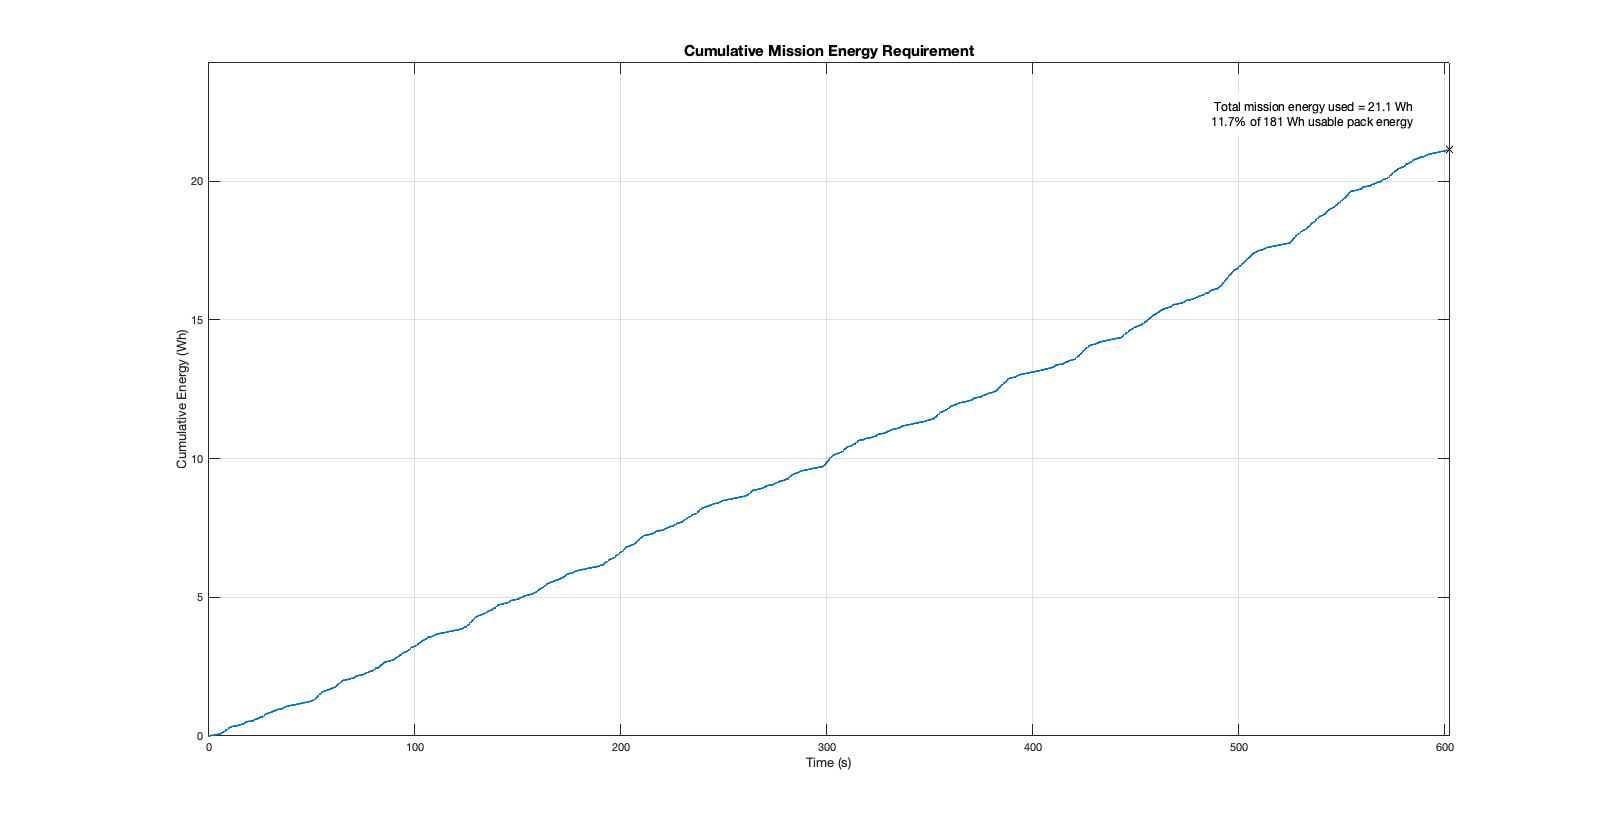
Figure D4.6 – Mission energy requirement versus that available from battery.
|
Parameter |
Value |
Notes |
|
Battery type |
24 V 10Ah Li-ion |
Elemex 24V 10Ah Lithium-ion Battery Pack with BMS [4] |
|
Nominal voltage |
24V |
Datasheet |
|
Nominal capacity |
10Ah |
Datasheet rated capacity |
|
Nominal energy |
259Wh |
Datasheet |
|
Usable energy |
181Wh |
70 % usable depth-of-discharge assumed for sizing |
|
Continuous discharge current |
20A |
Datasheet maximum constant discharge current |
|
Peak discharge current |
60A (3–5 s) |
Peak current rating |
|
Simulated peak bus current |
15.7A |
From Simulink mission energy model |
|
Estimated mass |
1.22kg |
Datasheet battery weight |
|
Chassis battery allowance |
4 kg |
From chassis mass budget |
|
Missions per charge |
8 |
181Wh usable / 21.1Wh per mission |
Figure D4.7 – Battery selection data and mission requirements.
Test results
Table E1 summarises the results of the subsystem validation against the defined success criteria. Quantitative performance is extracted from logged simulation data and the Simulink power model, with qualitative behaviour demonstrated via a single integrated test video (Figure E2).
|
Requirement |
Success criteria |
Discussion |
Outcome |
|
M01 Slope drive torque |
τdrive ≤ 8.5Nm |
Peak pull-away torque reaches 8.4Nm (Fig. E3) before settling to lower steady-state values. This is below the drive motor limit. |
PASS |
|
M02 Traction margin |
ωactual ≥ 0.9 ωcmd |
Both tracks maintain a ratio above the 0.9 threshold, demonstrating acceptable slip (Fig. E4). The test was conducted at μ = 0.5 below the specified μ = 0.6, providing additional margin. |
PASS |
|
M03 Ground clearance |
Clearance ≥ 0.20m |
Minimum clearance reduces to 0.172m during step traversal due to suspension compression and approach geometry (Fig. E5) |
FAIL |
|
M04 Step negotiation pitch |
θmax ≤ 32° |
A peak pitch of 2.3° is recorded (Fig. E6), well below the calculated pitch-over limit. |
PASS |
|
M05 Envelope & manoeuvrability |
No contact. Navigates min step width. |
Successful navigation within room envelope, door aperture and 1m wide steps – Figure E2. |
PASS |
|
M06 Slope hold rollback (10 s) |
Δs ≤ 0.2 m |
Rollback limited to 0.019m over 10s. (Fig. E7) |
PASS |
|
M07 Cruise / sprint speed |
Median cruise speed is 1.41 m/s, sprint speed reaches 2.53 m/s. (Fig. E8) |
PASS | |
|
M08 Battery capacity |
Emission ≤ 70% |
Mission energy calculated from the Simulink model is 21.1Wh. This is 12% of the battery’s usable energy and permits 8 full missions before charge. (Fig. D4.6) |
PASS |
|
M09 Power electronics current rating |
Irms, Ipeak ≤ 20A
Bus power < 480W |
Irms = 6.40A, Ipeak = 15.68A (Fig. E10). Peak bus power is 376 W (Fig. E9). |
PASS |
|
M10 System monitoring |
All signals logged; faults flagged. |
No current or torque limit flags were triggered during the mission. (Fig. E11) |
PASS |
Figure E1 – Mechatronics subsystem test results matrix.
Figure E2 – Integrated mechatronics test video (M01–M07) in CoppeliaSim.
This video demonstrates the slope pull-away and hold, step traversal, envelope navigation, and cruise speed test within a single test arena. The slope hold rollback section is time-compressed for convenience.
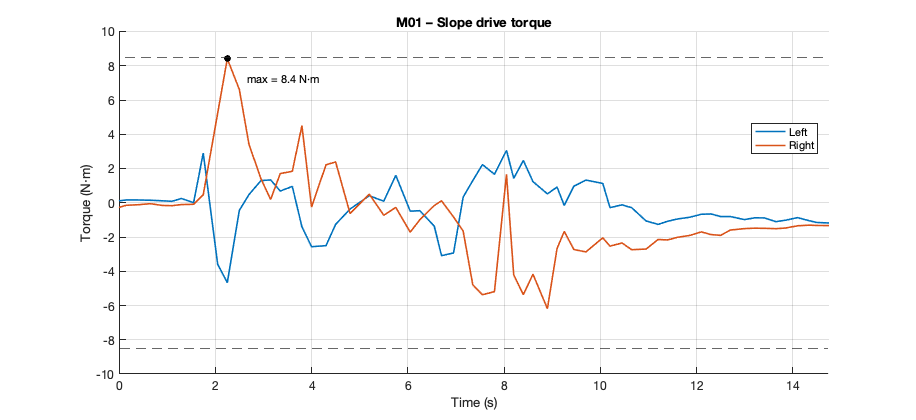
Figure E3 – 10% slope drive torque (M01).
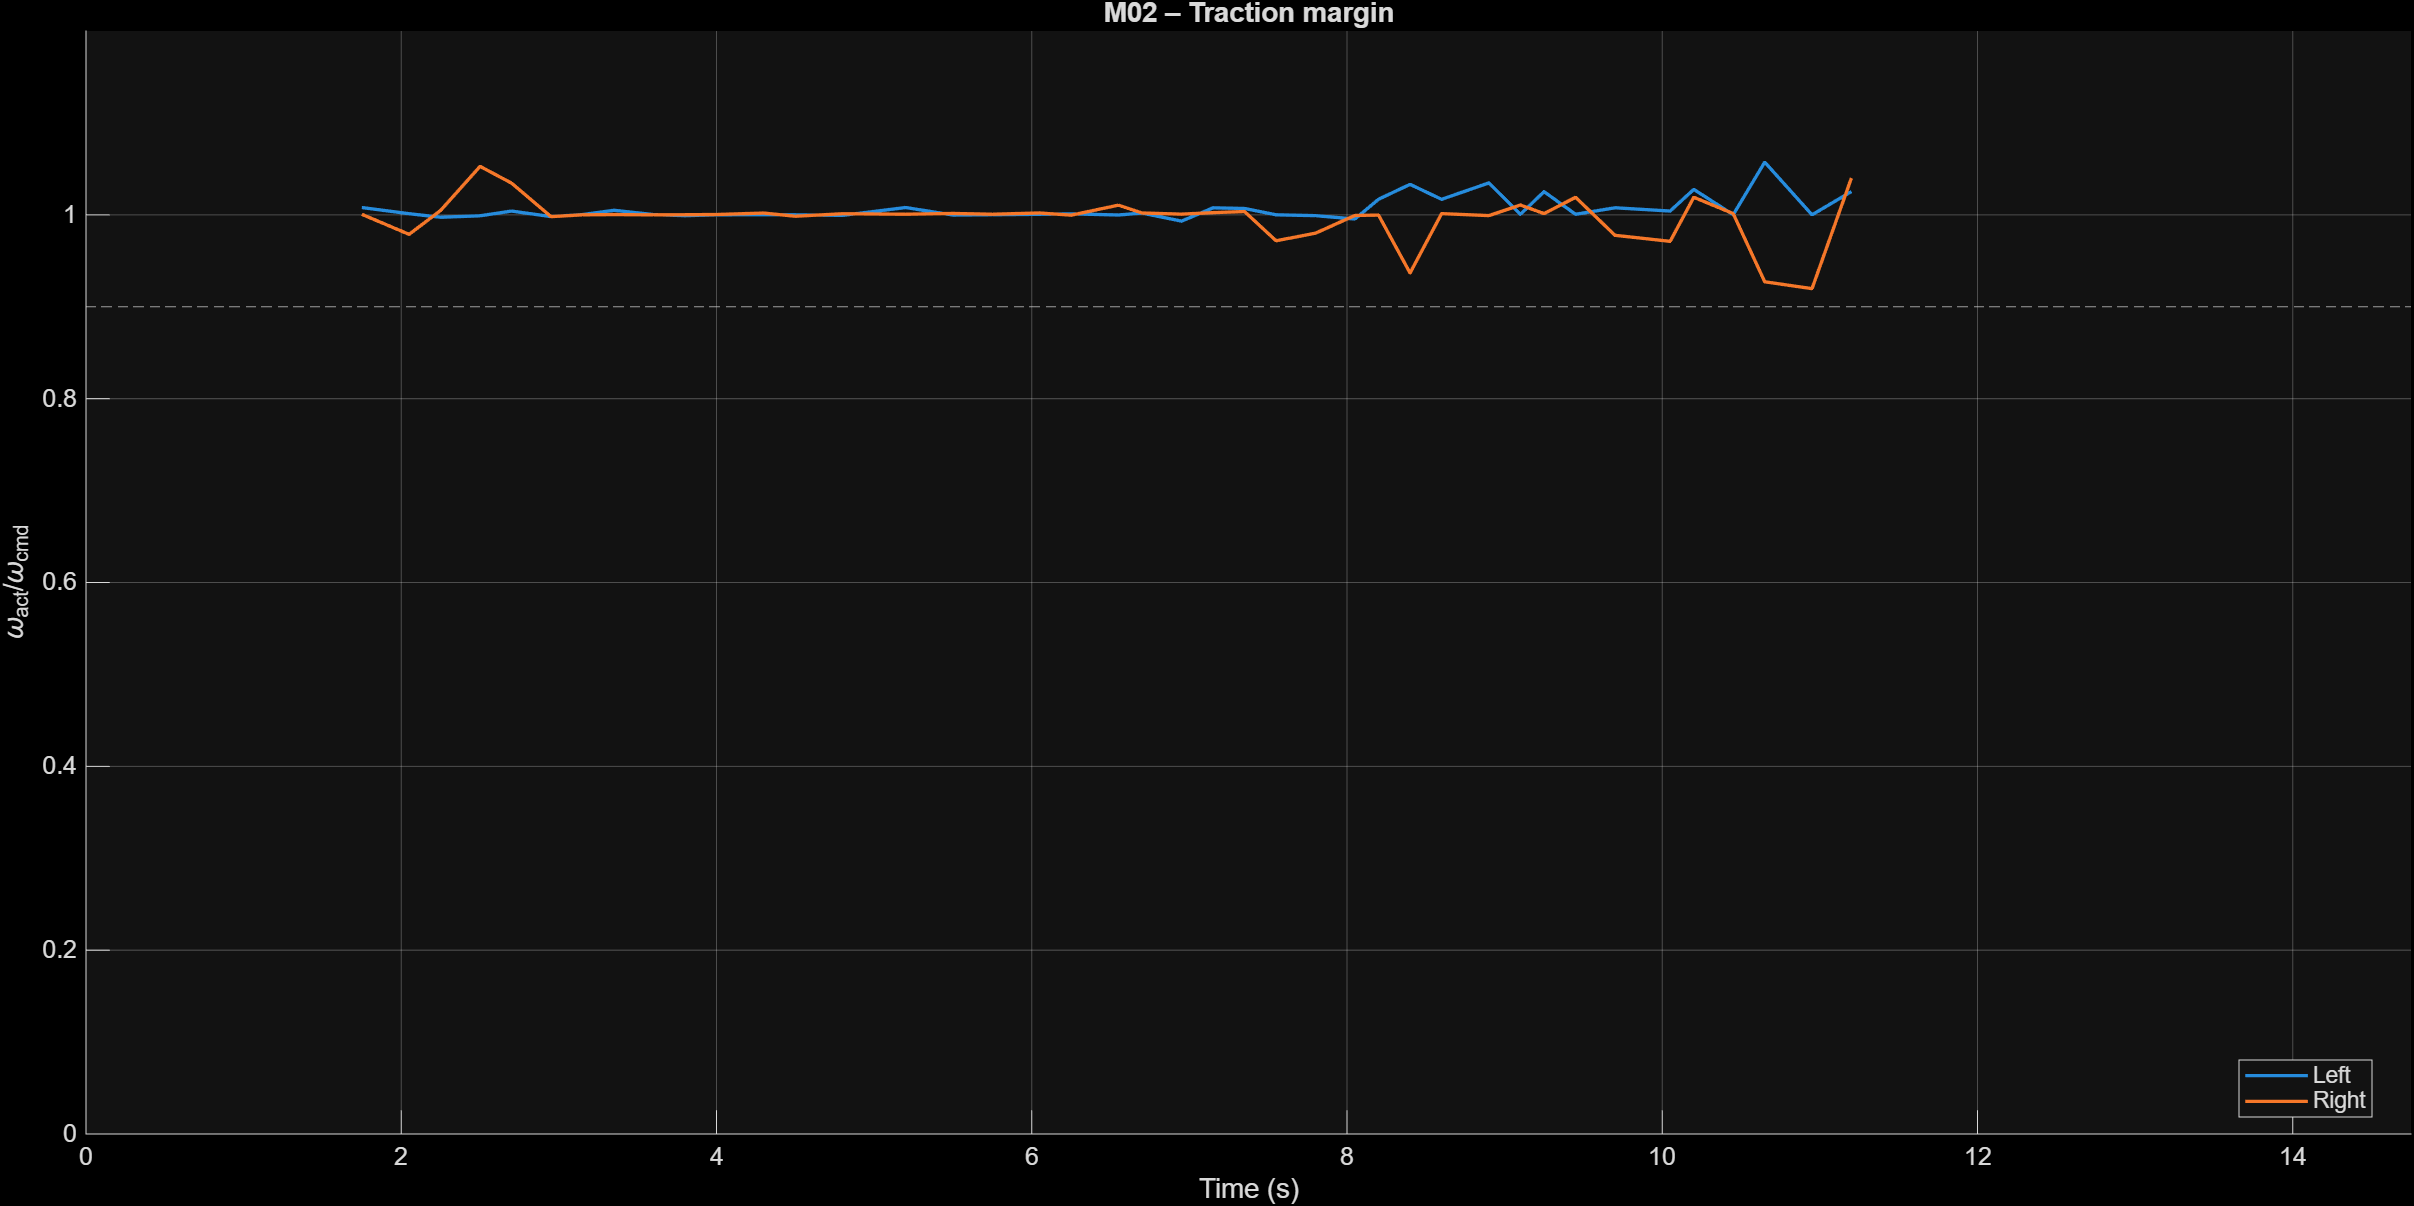
Figure E4 – Traction margin at μ = 0.5 (M02).
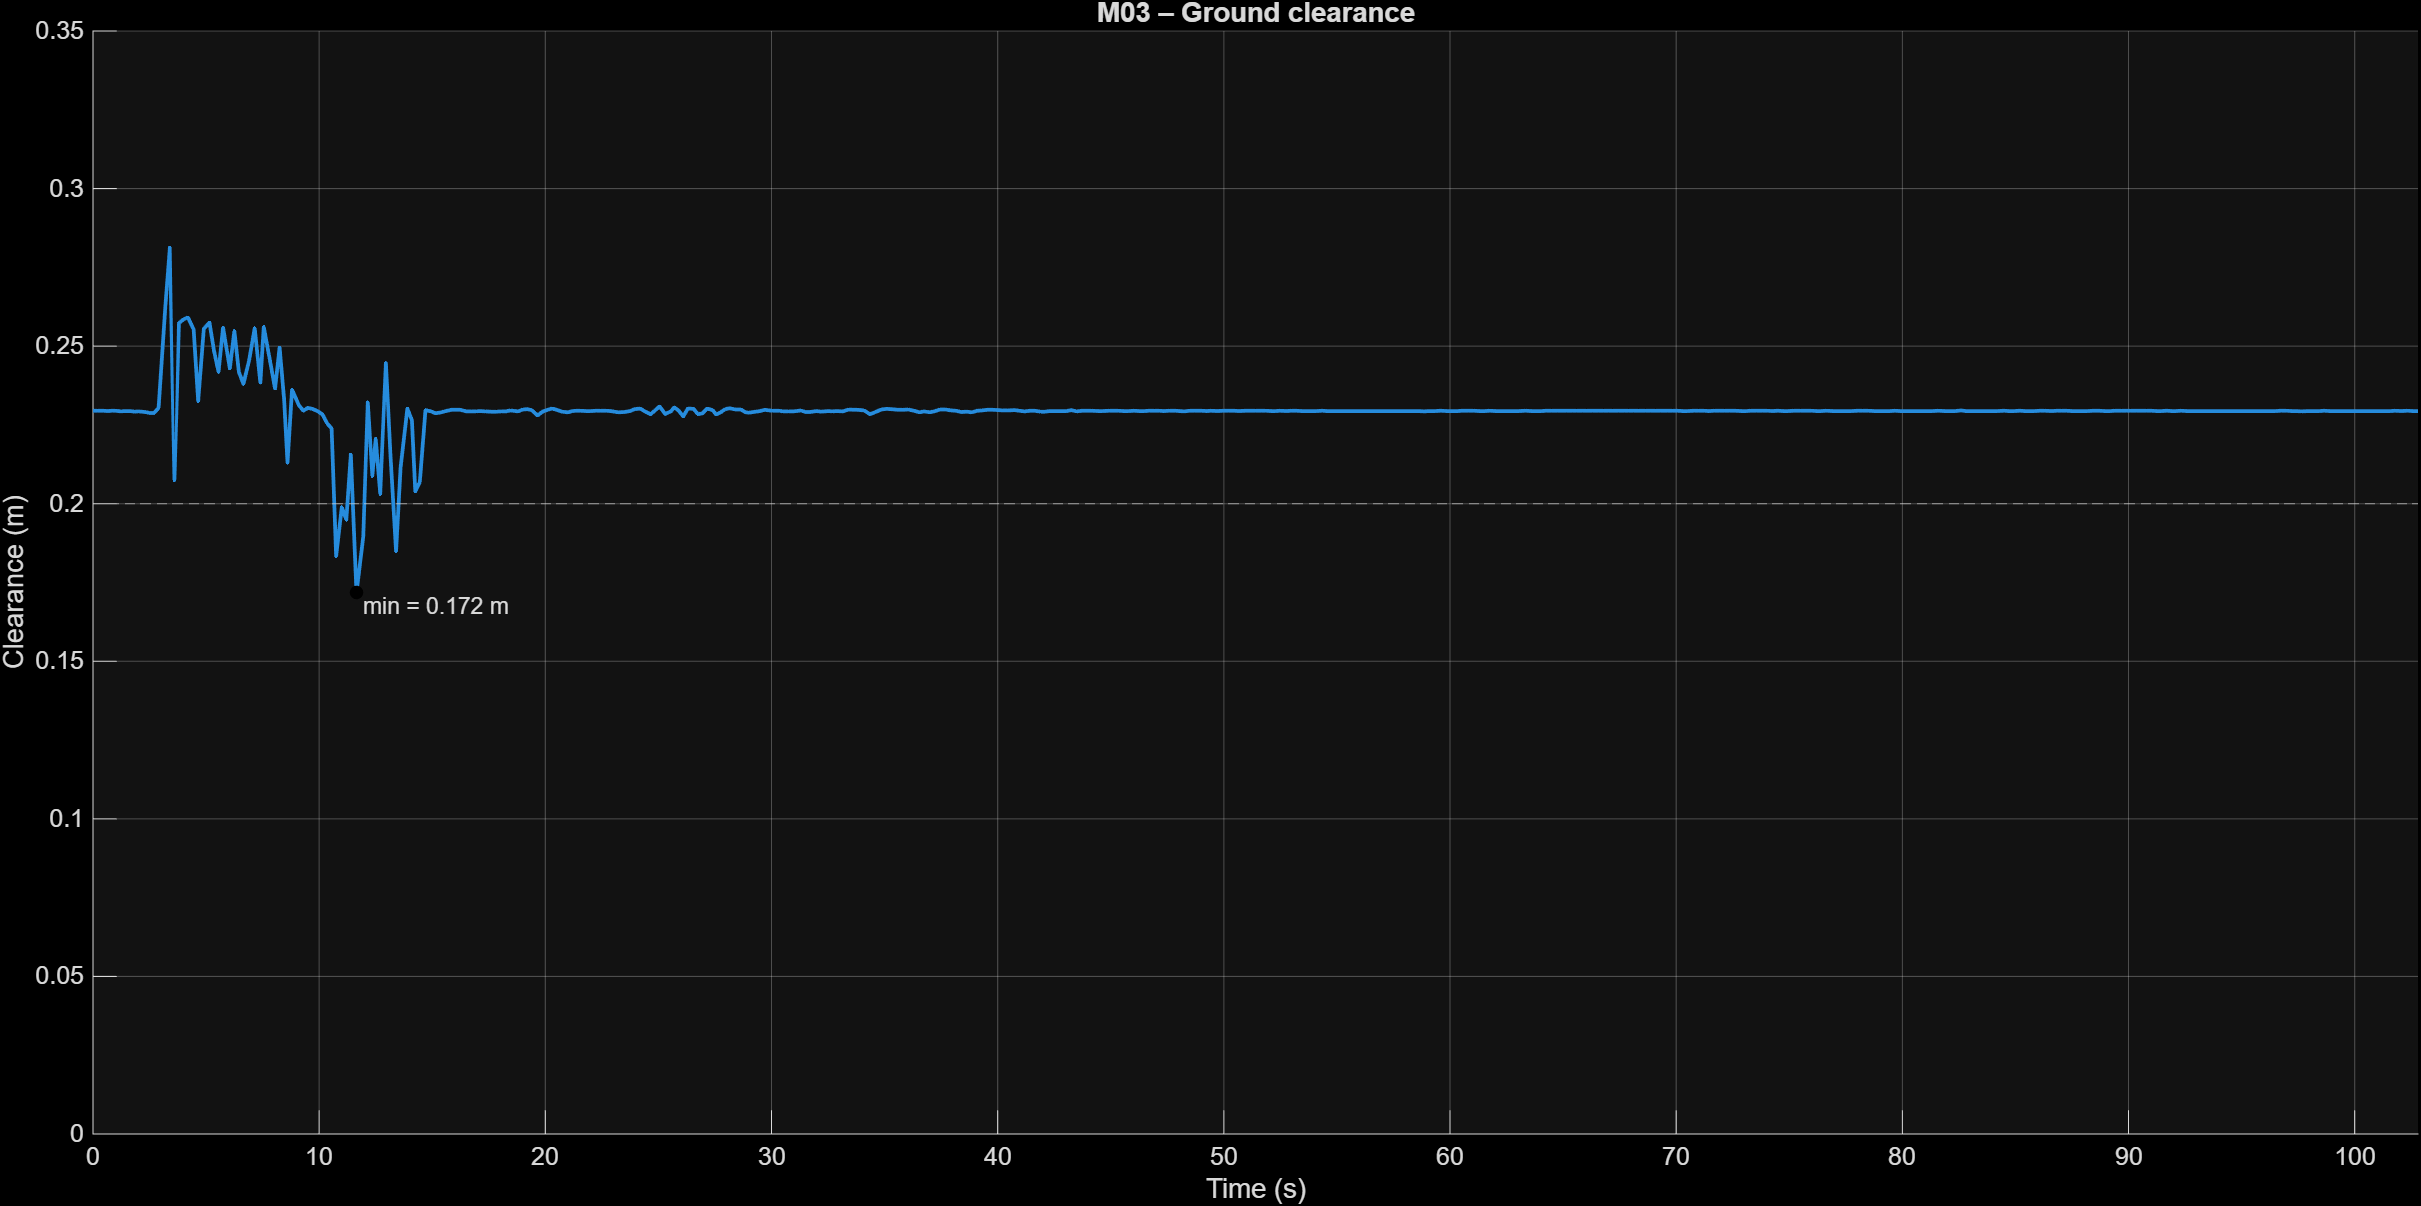
Figure E5 – Ground clearance during step traversal (M03).
The clearance shortfall occurs during dynamic step interaction, where suspension compression and obstacle approach geometry momentarily reduce clearance. The condition represents an unlikely scenario (step + obstacle coincidence) and does not affect operation on flat or sloped terrain.
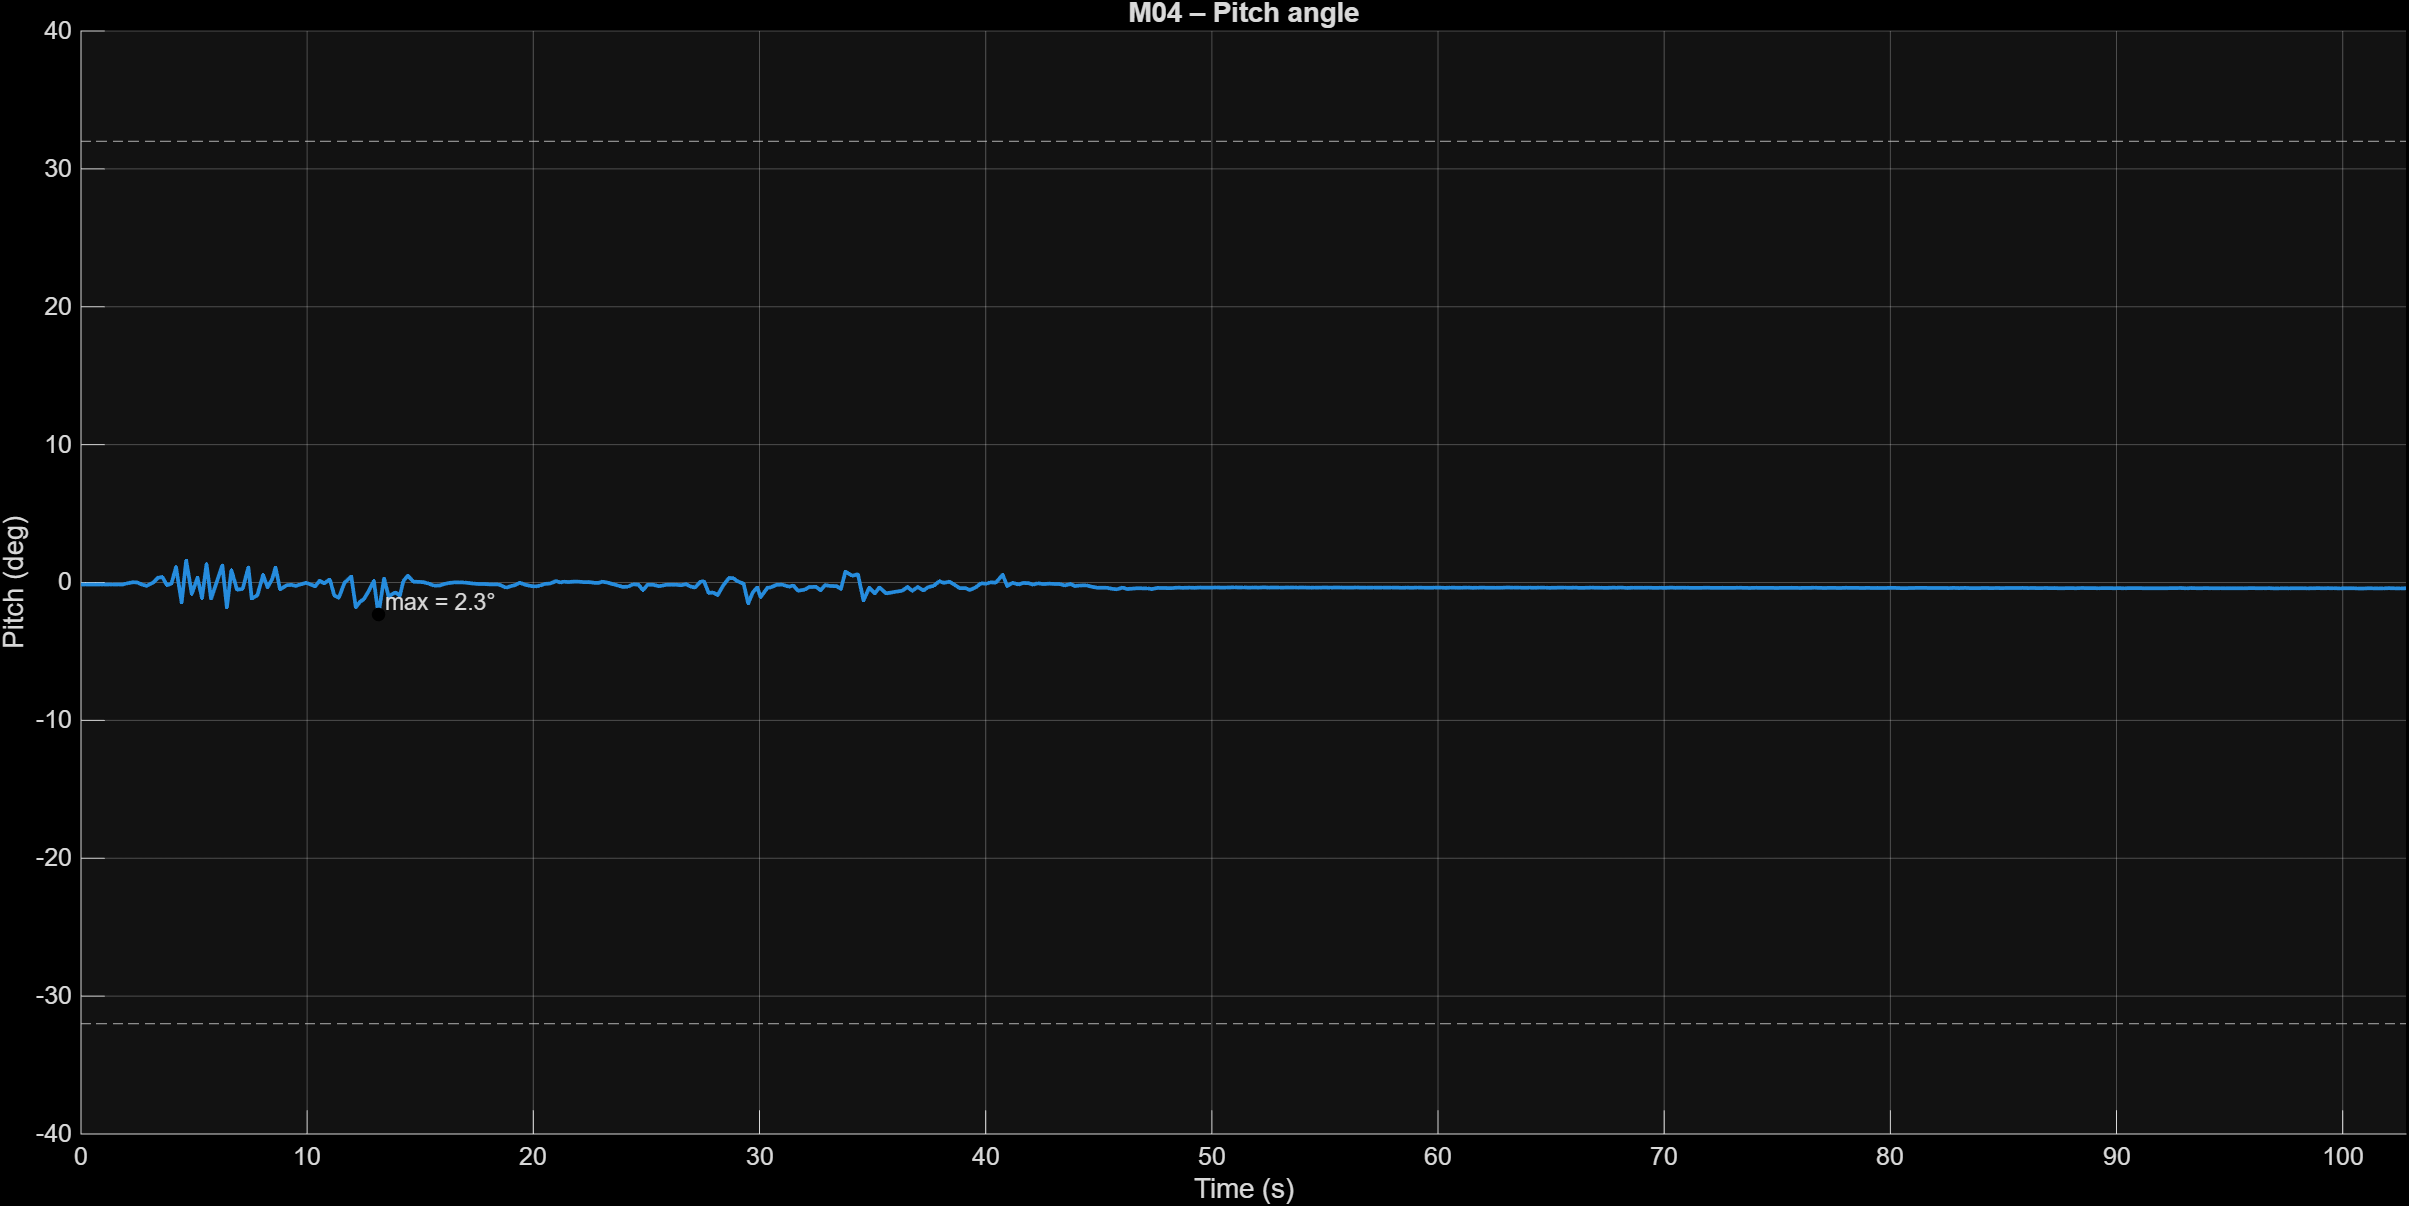
Figure E6 – Pitch angle during step negotiation (M04).
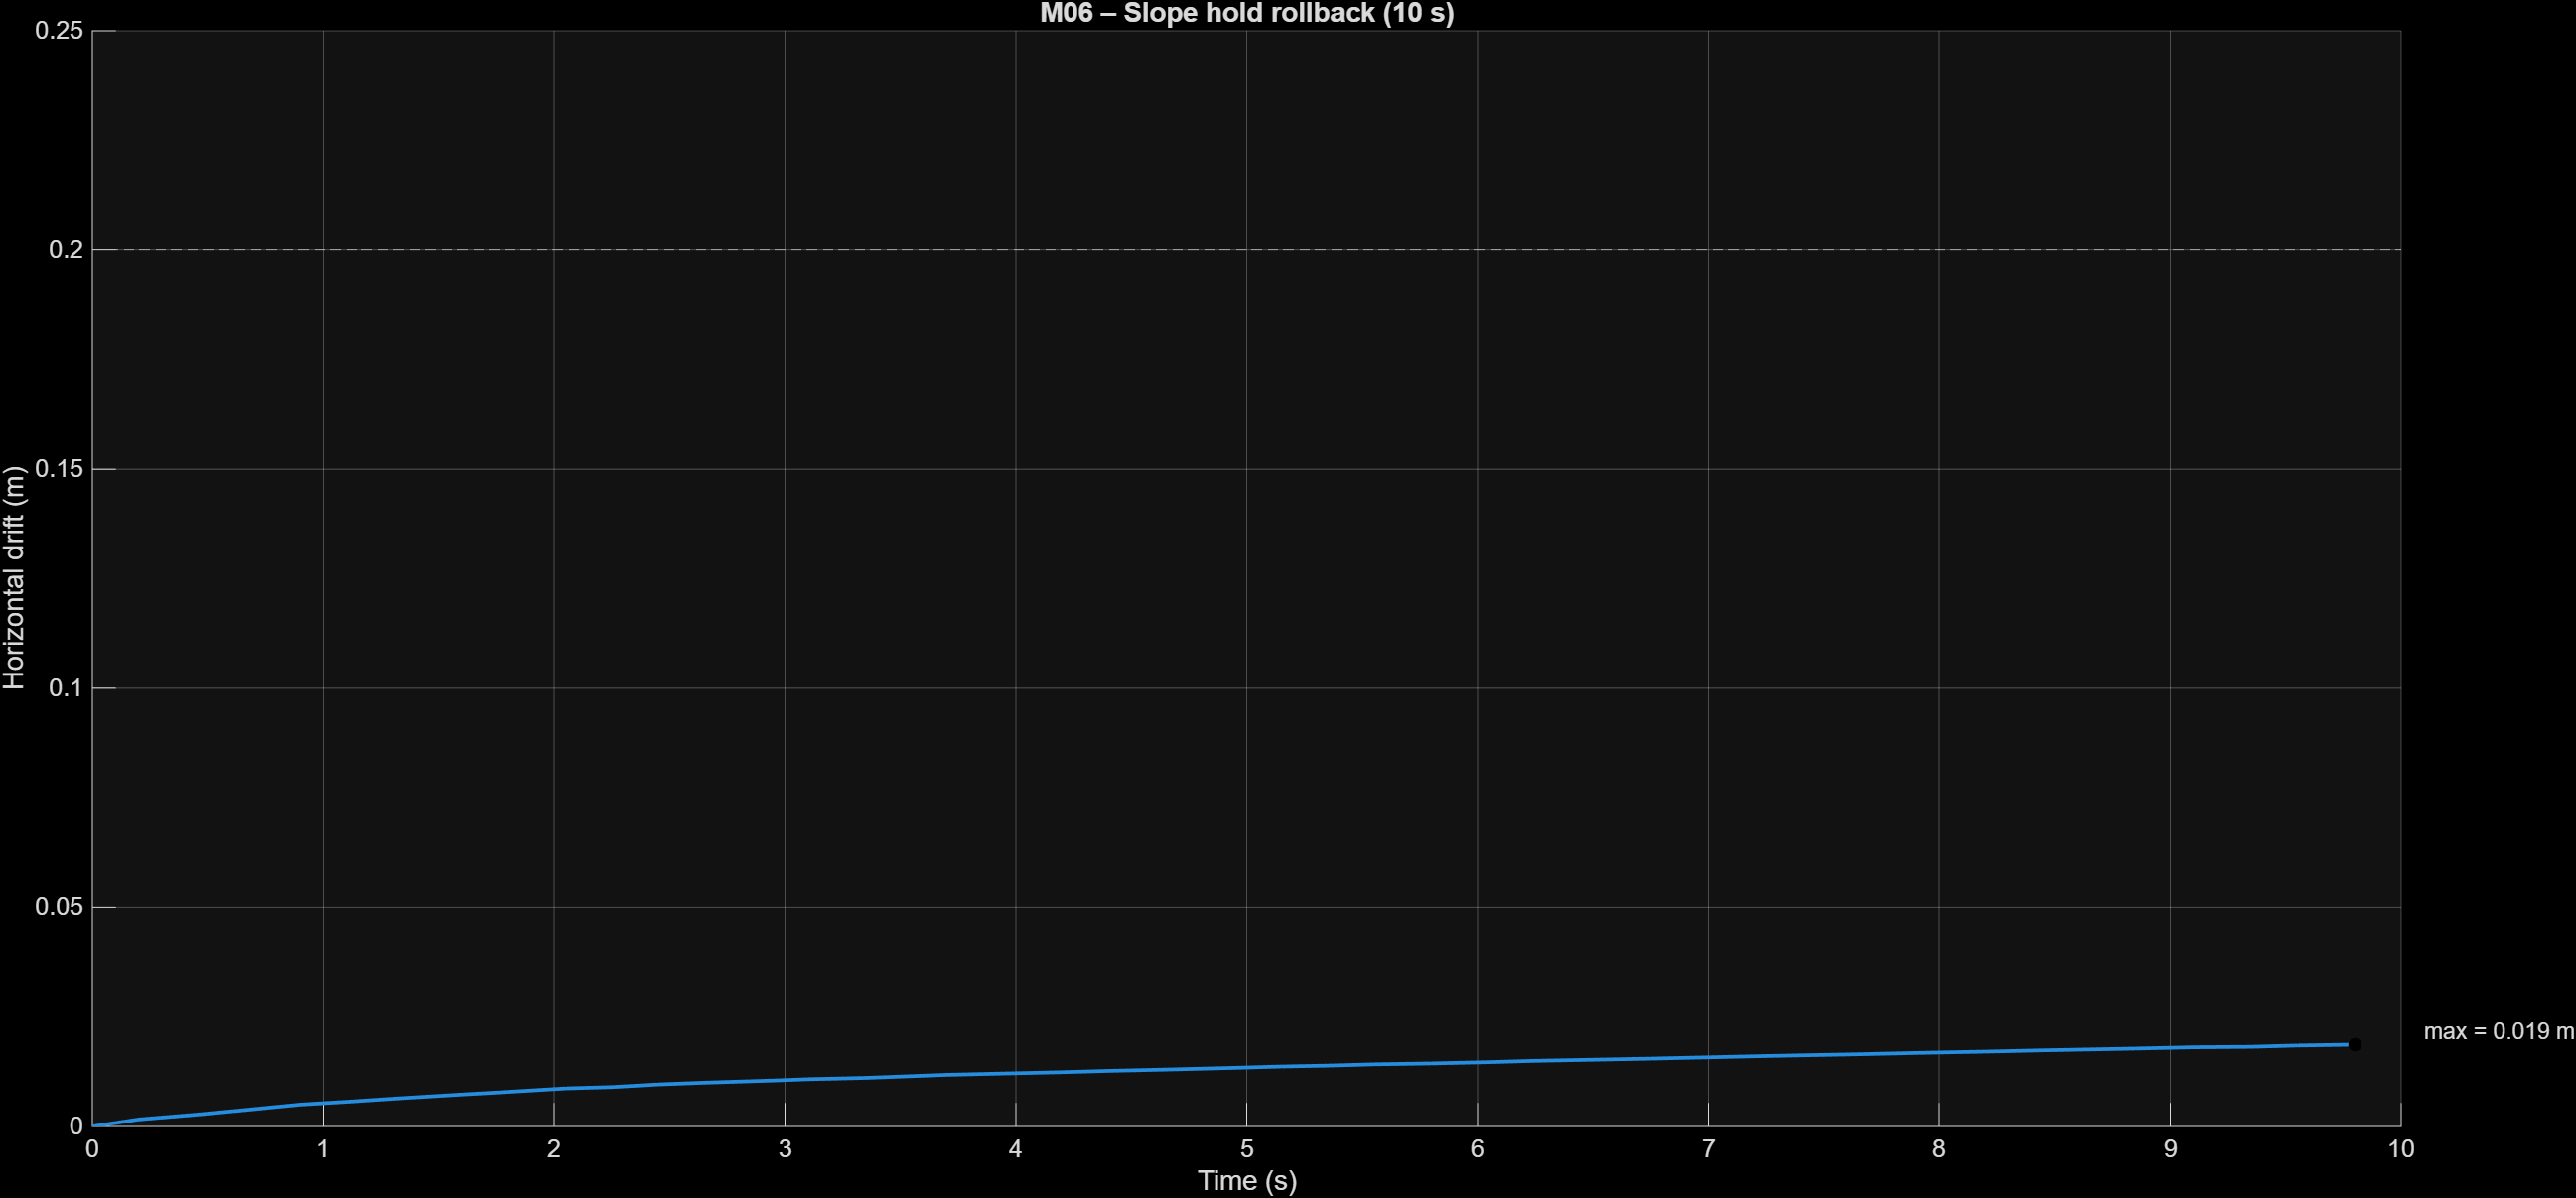
Figure E7 – Slope hold rollback over 10 s (M06).
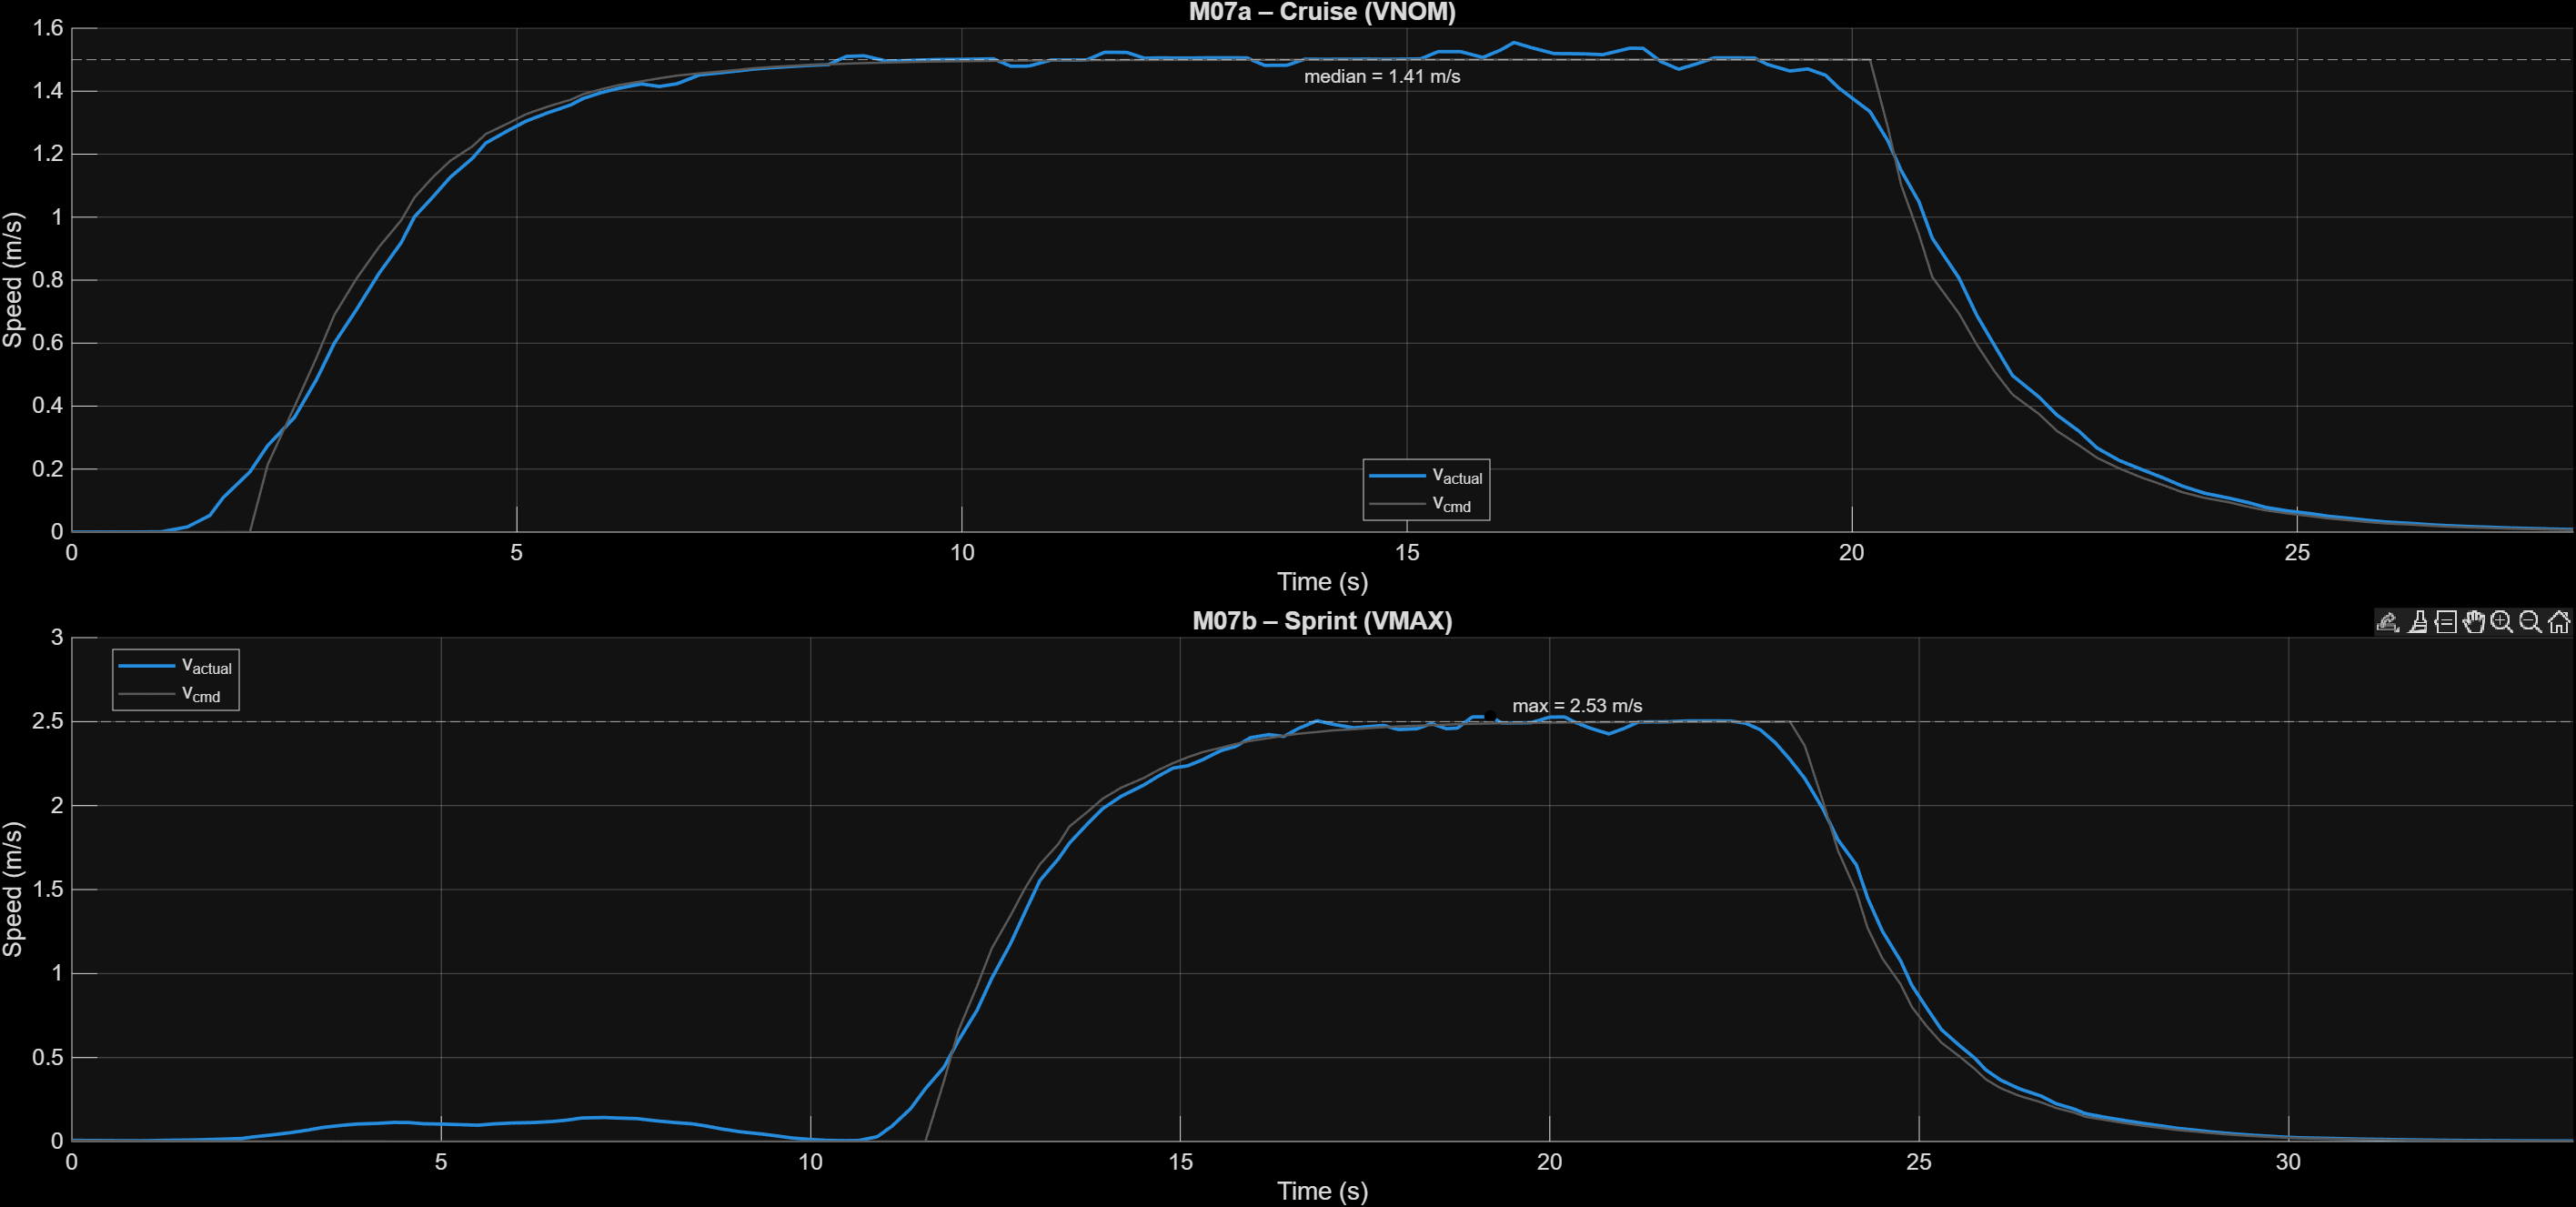
Figure E8 – Cruise and sprint speed performance (M07).
The reported cruise median includes sections of acceleration and deceleration phases. Steady-state tracking aligns closely with the command value of 1.5m/s, suggesting the result reflects inaccuracy in assessment window definition rather than traction.
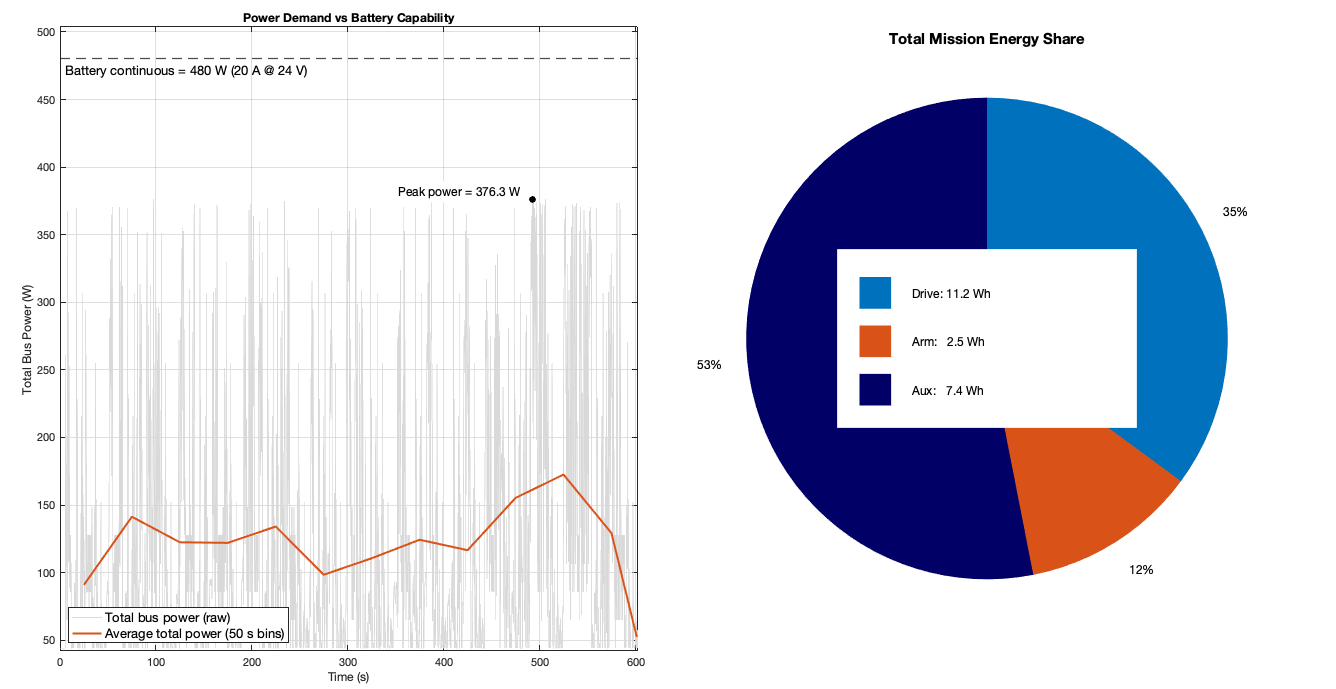
Figure E9 – Power demand versus battery capability and energy distribution.
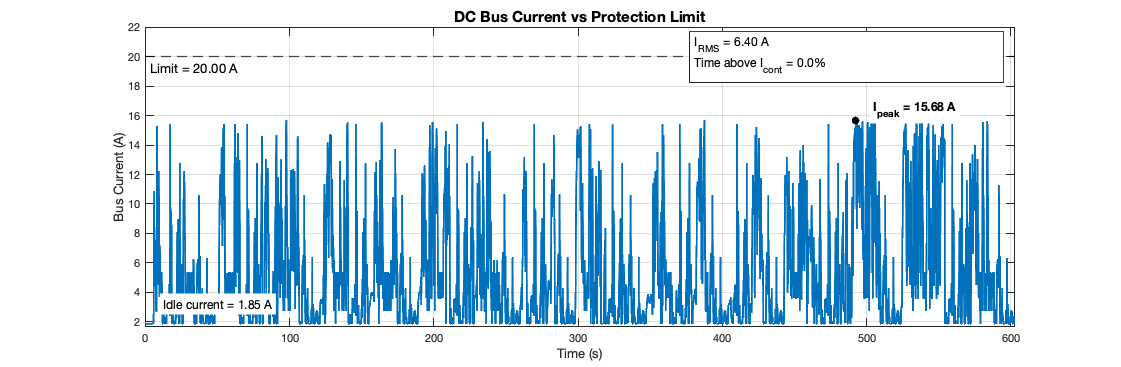
Figure E10 – DC bus current versus protection limit.
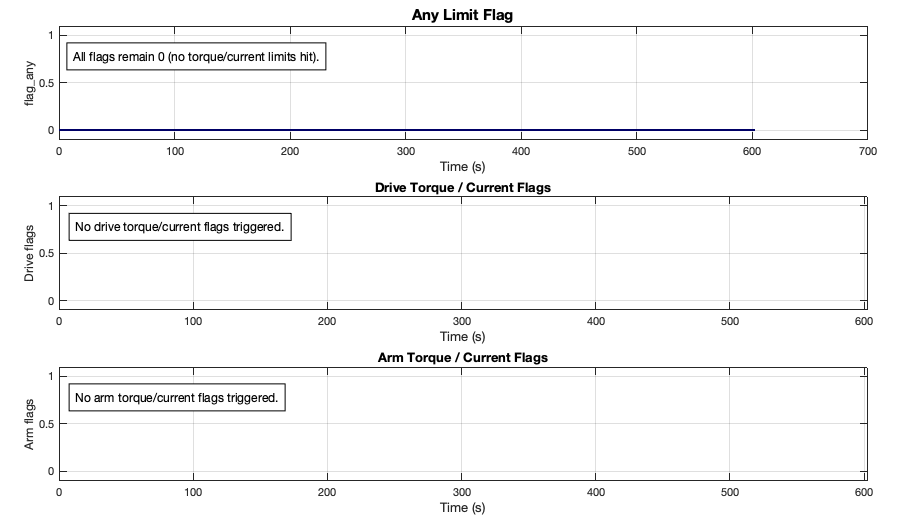
Figure E11 – Limit flag summary for drive and arm subsystems.
Design Reflection
The tracked 24V chassis concept demonstrably satisfies its requirements, with all criteria passing except ground clearance (M03), validated through full-mission integrated testing.
Electrical performance shows substantial real-world margin: peak bus current (15.68A) and power (376W) remain well below the 20A continuous battery limit, while total mission energy is approximately 12% of usable capacity. This enables 8 complete missions per charge.
Practical deployment constraints were explicitly designed and tested for, including reduced friction, voltage derating, sensor noise, and clearance loss under suspension compression. The resulting margins indicate a robust and conservatively sized system. Traction performance remains within limits at μ = 0.5, below the specified requirement, while stability performance exceeds the design target by over an order of magnitude (θmax = 2.3° vs 32°, rollback = 0.019m vs 0.2m).
Requirement sensitivity highlights clear system boundaries. A tighter pitch constraint (10°) would pass with significant headroom, whereas a steeper slope (20%) would become torque limited, as the 10% launch transient already approaches the motor limit. This is a controlled and well-understood limitation, addressable through launch shaping or increased torque capacity.
The only failure, ground clearance, is a geometric compliance issue rather than a control or power limitation. It can be resolved through modest chassis and suspension revisions. Overall, the subsystem demonstrates strong performance and predictable failure modes.
Figure R1 – Video of complete Coppelia design navigating test environment.
Bibliography and Appendix
References:
[1] E. G. Papadopoulos and D. A. Rey, “A new measure of tipover stability margin for mobile manipulators,” in Proc. IEEE Int. Conf. Robot. Autom. (ICRA), Minneapolis, MN, USA, Apr. 1996, pp. 3111–3116, doi: 10.1109/ROBOT.1996.509185.
[2] R. A. Lindemann and C. J. Voorhees, “Mars Exploration Rover mobility assembly design, test and performance,” in Proc. 2005 IEEE Int. Conf. Systems, Man and Cybernetics, Waikoloa, HI, USA, Oct. 2005.
[3] A. Pappalettera, G. Reina, and G. Mantriota, “Design and analysis of tracked stair-climbing robot using innovative suspension system,” Robotics, vol. 13, no. 3, p. 45, 2024, doi: 10.3390/robotics13030045.
[4] Elemex Pty Ltd, “Rectangle 24V 10Ah Lithium-ion Battery Pack with BMS and Bluetooth + Waterproof Case,” Elemex, 2025. [Online]. Available: https://elemex.com.au/product/rectangle-24v-10ah-lithium-ion-battery-pack-with-bms-and-bluetooth-waterproof-case/. [Accessed: Dec. 12, 2026].
[5] Motion Dynamics, “MY1020Z 24V 500W DC Planetary Gear Motor, 500RPM,” product page. [Online]. Available: https://motiondynamics.com.au (accessed Dec. 20, 2026).
[6] Dimension Engineering, “Sabertooth 2x32 Regenerative Dual Motor Driver,” product datasheet. [Online]. Available: https://www.dimensionengineering.com (accessed Dec. 21, 2026).
[7] StepperOnline, “750W DC Servo Motor Kit, 60V, 2.39 Nm Rated Torque, DSY series,” product page. [Online]. Available: https://www.omc-stepperonline.com (accessed Dec. 21, 2026).
[8] maxon Group, “EC-i 52, Ø52 mm, brushless, 200 W,” motor datasheet. [Online]. Available: https://www.maxongroup.com (accessed Dec. 22, 2026).
[9] Ouster, Inc., “OS1 Digital LiDAR Sensor – Product Datasheet,” rev. OS1-Rev06, 2022. [Online]. Available: https://ouster.com (accessed Dec. 22, 2026).
[10] NVIDIA Corp., “NVIDIA Jetson Orin Nano Series Modules – Data Sheet,” 2024. [Online]. Available: https://developer.nvidia.com/embedded (accessed Dec. 28, 2026).
[11] STMicroelectronics, “VL53L1X Time-of-Flight Distance Sensor,” datasheet. [Online]. Available: https://www.st.com (accessed Dec. 29, 2026).
[12] Bosch Sensortec, “BNO055 Intelligent 9-Axis Absolute Orientation Sensor,” datasheet. [Online]. Available: https://www.bosch-sensortec.com (accessed Dec. 29, 2026).
Appendix:
M1 – Track height
For a circular wheel (or tracked segment) to climb a vertical obstacle unaided, the minimum radius is
\[ r_{\min}=\frac{h}{2} \]
For the 0.2 m steps (SYS06),
\[ r_{\min}=\frac{0.2}{2}=0.10~\mathrm{m} \]
A safety factor of 1.5 is applied in line with exploration robot mobility practice [1,2], giving a target effective radius
\[ r_{\mathrm{des}}=1.5\,r_{\min}=0.15~\mathrm{m} \]
This is met by the selected sprocket and track geometry [1,2].
M2 – Wheelbase
Steps are 0.2 m high and at least 0.5 m deep. The diagonal distance from the front edge of one step to the back edge of the next in this minimum case is
\[ d=\sqrt{0.5^{2}+0.2^{2}}=0.54~\mathrm{m} \]
To maintain at least two stair treads in contact with the tracks and avoid tipping, the chassis wheelbase L is chosen to be at least twice this spacing:
\[ L=2d=1.08~\mathrm{m} \]
The chosen wheelbase of 1.20 m exceeds this minimum, improving traction and reducing pitch-over risk during stair transitions [2,3].
M3 – Chassis ground clearance
The step geometry provides a slope
\[ \frac{\Delta h}{\Delta x}=\frac{0.2}{0.5}=0.4 \]
which corresponds to an incline of about 21.8°. This represents the worst-case approach and breakover condition. Chassis ground clearance is selected in the main text such that the belly does not contact the step edge at this slope, with margin against manufacturing tolerances and suspension deflection (requirement M03).
M4 – Drive torque sizing (10% slope, straight climb)
Inputs (design worst case)
Maximum vehicle mass: m=82 kg
Gravity: g=9.81 m/s^2
Slope: 10 % \[ \theta=\tan^{-1}(0.1) \]
Drive sprocket pitch radius: r_s=0.05 m
Rolling resistance (rubber tracks, straight climb): C_rr=0.05
Acceleration case: uphill pull-away a=0.5 m/s^2
Two tracks share the load equally.
Required tractive force along the slope
\[ F_{\mathrm{req}}=mg\left(\sin\theta+C_{rr}\cos\theta\right)+ma \]
Per track,
\[ F_{\mathrm{track}}=\frac{F_{\mathrm{req}}}{2},\qquad T=F_{\mathrm{track}}\,r_s \]
Computed load cases (per track)
Case A – steady/holding uphill (a=0)
\[ F_{\mathrm{track}}=60~\mathrm{N},\qquad T_A=3.0~\mathrm{N\,m} \]
Case B – uphill pull-away (a=0.5 m/s^2)
\[ F_{\mathrm{track}}=80.5~\mathrm{N},\qquad T_B=4.0~\mathrm{N\,m} \]
A design torque requirement per track of
\[ T_{\mathrm{req}}=4.0~\mathrm{N\,m} \]
is therefore adopted.
Traction check
With friction coefficient μ=0.6, the available friction force on a 10 % slope is
\[ F_{\mathrm{fric}}=\mu N=\mu mg=0.6\times 82\times 9.81=483~\mathrm{N} \]
which gives roughly three times margin over the required F_req on a 10 % slope.
Speed targets
Using \(\omega=v/r_s\):
\[ v=1.5~\mathrm{m/s}\Rightarrow \omega=30~\mathrm{rad/s}\Rightarrow 286~\mathrm{rpm} \]
\[ v=2.5~\mathrm{m/s}\Rightarrow \omega=50~\mathrm{rad/s}\Rightarrow 478~\mathrm{rpm} \]
Motor selection
A MY1020Z 24 V 500 W DC gearmotor with planetary gearbox (6.67:1) is specified per track [5]. Datasheet output torque is 8.5 N·m at about 500 rpm, giving about 2.1× margin over T_req and a theoretical maximum speed
\[ v_{\max}=2.6~\mathrm{m/s} \]
This satisfies both the slope torque and nominal speed requirements (M06, M07) [5].
M5 – Track motor electrical demand (per motor)
Inputs (from M4)
Torque cases: τ_A=3.0 N·m, τ_B=4.0 N·m
Sprocket radius: r_s=0.05 m
Target speed: v=1.5 m/s ⇒ \[ \omega=\frac{v}{r_s}=30~\mathrm{rad/s} \]
DC bus voltage: V_bus=24 V
Combined efficiency (motor + gearbox + driver): η=0.80
Mechanical power:
\[ P_{\mathrm{mech}}=\tau\,\omega \]
Case A (steady uphill):
\[ P_{\mathrm{mech}}=3.0\times 30=90~\mathrm{W} \]
Case B (pull-away):
\[ P_{\mathrm{mech}}=4.0\times 30=120~\mathrm{W} \]
Electrical power and current:
\[ P_{\mathrm{elec}}=\frac{P_{\mathrm{mech}}}{\eta},\qquad I=\frac{P_{\mathrm{elec}}}{V_{\mathrm{bus}}} \]
Case A:
\[ P_{\mathrm{elec}}=\frac{90}{0.80}=112.5~\mathrm{W},\qquad I=\frac{112.5}{24}=4.69~\mathrm{A} \]
Case B:
\[ P_{\mathrm{elec}}=\frac{120}{0.80}=150~\mathrm{W},\qquad I=\frac{150}{24}=6.25~\mathrm{A} \]
Motor datasheet rated current (24 V, 500 W class) is I_rated=26.7 A [5]. The driver selected is a Sabertooth 2×32, rated 32 A continuous and 64 A peak with a 6–30 V nominal input range. For a 6S Li-ion pack the maximum fully charged voltage is
\[ V_{\max}=6\times 4.2=25.2~\mathrm{V} \]
which is within the driver’s absolute maximum rating.
M6 – Arm actuator selection (for Simulink power model)
M6.1 Equations
Motor torque required for a given joint torque:
\[ \tau_m=\frac{\tau_{\mathrm{joint}}}{G\,\eta_g} \]
Joint torque capability from a motor and gearbox:
\[ \tau_{\mathrm{joint,cap}}=\tau_{m,\mathrm{cap}}\,G\,\eta_g \]
Electrical power used in the Simulink model:
\[ P_{\mathrm{elec}}(t)=\frac{\tau_{\mathrm{joint}}(t)\,\omega_{\mathrm{joint}}(t)}{\eta_g\,\eta_{\mathrm{drv}}} \]
\[ I_{\mathrm{bus}}(t)=\frac{P_{\mathrm{elec}}(t)}{V_{\mathrm{bus}}} \]
Assumptions:
Gearbox efficiency: \(\eta_g=0.85\)
Servo driver efficiency: \(\eta_{\mathrm{drv}}=0.90\)
DC bus voltage: V_bus=24 V
M6.2 Inputs (Robotics structural sizing)
Joint static and design torques:
Shoulder pitch (J1): τ_static=237.7, τ_design=680.6 N·m
Elbow pitch (J2): τ_static=108.9 N·m, τ_design=235.9 N·m
Wrist pitch (J3): τ_static=11.5 N·m, τ_design=16.2 N·m
Base yaw (J0): τ_design=400.0 N·m
M6.3 Gear ratio choice and motor selection
Reference gearbox type: Harmonic Drive CSG-2UH style units with ratios 50:1, 80:1, 100:1, 120:1 and 160:1 and peak torque capacities up to 3419 N·m.
Motor candidates:
StepperOnline DSY 750 W DC servo, rated torque 2.39 N·m, peak torque 7.17 N·m, driver input 24–70 V DC [6].
maxon EC-i 52 (24 V, 200 W) BLDC motor, nominal torque 0.646 N·m, stall torque 6.82 N·m [7].
Sizing check with \(\eta_g=0.85\):
Shoulder (J1):
G=120, τ_(m,rated)=2.39 N·m, τ_(m,peak)=7.17 N·m
\[ \tau_{\mathrm{joint,cap,rated}}=2.39\times 120\times 0.85=244~\mathrm{N\,m} \]
\[ \tau_{\mathrm{joint,cap,peak}}=7.17\times 120\times 0.85=731~\mathrm{N\,m} \]
Elbow (J2):
G=80
\[ \tau_{\mathrm{joint,cap,rated}}=2.39\times 80\times 0.85=163~\mathrm{N\,m} \]
\[ \tau_{\mathrm{joint,cap,peak}}=7.17\times 80\times 0.85=488~\mathrm{N\,m} \]
Base yaw (J0):
G=80, τ_(joint,cap,rated)=163 N·m, τ_(joint,cap,peak)=488 N·m
Wrist (J3), maxon EC-i 52:
G=50, τ_(m,rated)=0.646 N·m, τ_(m,peak)=6.82 N·m
\[ \tau_{\mathrm{joint,cap,rated}}=0.646\times 50\times 0.85=27.5~\mathrm{N\,m} \]
\[ \tau_{\mathrm{joint,cap,peak}}=6.82\times 50\times 0.85=290~\mathrm{N\,m} \]
These joint torque caps are used as the limits in the Simulink power model [6,7].
M7 – Auxiliary loads
M7.1 Auxiliary electrical power budget
Subsystem items and powers used in the Simulink mission energy model:
360° LiDAR (e.g. OS1) on 24 V rail: P_LiDAR=16 W
Compute (Jetson Orin Nano) on 5 V rail: P_compute=15 W
RGB cameras on 5 V rail: P_cameras=4×1.0 W=4 W
Proximity ToF sensors (4 units) on 5 V rail: P_ToF=4×0.02 W=0.08 W
IMUs (2 units) on 3.3/5 V rail: P_IMU=2×0.04 W=0.08 W
Radio / telemetry on 24 V rail: P_comms=7 W (upper bound)
DC-DC 24 V → 5 V converter efficiency: \(\eta_{\mathrm{dc,5V}}=0.90\)
M7.2 Electrical constants used in the Simulink power model
The following constants are implemented in the MATLAB parameter structure and used directly by the Simulink mission energy model:
V_bus=24 V (DC bus voltage)
η_(drive,total)=0.80 (track motor + gearbox + driver efficiency)
η_(arm,total)=0.70 (arm gearbox + servo driver efficiency)
η_(dc,5V)=0.90 (24 V → 5 V DC-DC converter efficiency)
τ_(drive,limit)=8.5 N·m, I_(drive,limit)=26.7 A (MY1020Z rated torque and current) [5]
τ_(arm,yaw,limit)=163 N·m
τ_(arm,pitch1,limit)=244 N·m
τ_(arm,pitch2,limit)=163 N·m
τ_(arm,pitch3,limit)=27.5 N·m
(joint torque caps from Robotics structural sizing)
I_(arm,limit)=15 A (assumed continuous current per arm joint, used for flagging only)
P_(LiDAR,24V)=16 W
P_(comms,24V)=7 W
P_(5V,total)=19.16 W (total 5 V rail load from auxiliary power budget)
M8 – CoppeliaSim operation data and power-model input
The mission energy model is driven by actuator torque and speed logs exported from CoppeliaSim for the full 10-container biohazard recovery mission:
Joint torque τ_i(t) and angular velocity ω_i(t) are recorded for:
Left and right track drives
Base yaw, shoulder, elbow and wrist joints.
Logs are exported as a single CSV file at fixed timestep Δt.
In MATLAB, this CSV is converted into a structured workspace variable and imported into Simulink using a single From Workspace block. This keeps the power model traceable to the validated dynamic simulation.
The full mission log CSV is attached in the comments.
M9 – Suspension sizing
Worst-case total mass with payload:
m_total=66.1 kg
The suspension is approximated as a vertical linear spring–damper supporting the sprung mass
\[ m_s=m_{\mathrm{total}}-m_{\mathrm{unsprung}}=66.1-9.5=56.6~\mathrm{kg} \]
A static sag target of δ=15 mm is selected to reduce bounce from arm/payload motion while retaining compliance for uneven terrain.
Total vertical stiffness:
\[ K_{\mathrm{tot}}=\frac{m_s g}{\delta}=\frac{56.6\times 9.81}{0.015}=3.70\times 10^{4}~\mathrm{N/m} \]
With 8 bogie dampers in parallel:
\[ k_{\mathrm{each}}=\frac{K_{\mathrm{tot}}}{8}=4.63\times 10^{3}~\mathrm{N/m} \]
Damping ratio target \(\zeta=0.7\) is used for a well-damped second-order response:
\[ c_{\mathrm{tot}}=2\zeta\sqrt{K_{\mathrm{tot}}\,m_s},\qquad c_{\mathrm{each}}=\frac{c_{\mathrm{tot}}}{8} \]
This gives
\[ c_{\mathrm{each}}=253~\mathrm{N\,s/m} \]
M10 – Battery pack selection and sizing
The Simulink mission energy model predicts a total electrical energy demand of 21.1 Wh for the full 10-container recovery mission (Section D4.3).
A 24 V 10 Ah Li-ion e-bike–class traction pack is selected, based on a representative commercial product with datasheet values [4]:
Nominal voltage: 24 V
Capacity: 10 Ah
Nominal energy: 259 Wh
Continuous discharge current: 20 A
Peak discharge current: 60 A for 3–5 s
Pack mass: 1.22 kg
A conservative usable depth-of-discharge of 70 % is applied:
\[ E_{\mathrm{usable}}=0.70\times 259=181~\mathrm{Wh} \]
This gives:
Missions per charge:
\[ N_{\mathrm{missions}}=\frac{E_{\mathrm{usable}}}{E_{\mathrm{mission}}}=\frac{181}{21.1}\approx 8\text{–}9 \]
Simulated peak bus current:
\[ I_{\mathrm{bus,peak}}=15.7~\mathrm{A}<20~\mathrm{A} \]
So both energy and current requirements are met with margin. The pack mass of 1.22 kg lies within the 4 kg chassis battery allowance. This appendix supports the battery summary in D4.3 (Figure/Table D4.7) and the 20 A current-limit line used in the mission power plots [4].
Appendix M11 – Tip-over pitch angle calculation
The forward tip-over pitch angle θ_tip is estimated from the chassis contact length and worst-case centre of gravity height. Static tip-over occurs when the CG line of action passes through the front contact point, giving
\[ \tan(\theta_{\mathrm{tip}})=\frac{(L/2)}{h_{\mathrm{CG}}} \]
where L is the ground contact length and h_CG is the CG height above ground. For the tracked chassis L=1.2 m and the fully-loaded configuration with the arm fully vertically raised gives h_CG=0.96 m. Substituting yields
\[ \theta_{\mathrm{tip}}=\tan^{-1}\!\left(\frac{0.6}{0.96}\right)\approx 32^\circ \]
The M04 step-negotiation requirement therefore uses θ_max=32° as the allowable pitch magnitude during ascent and descent.
Appendix M12 – Full Simulink model pictures: