Subsystem 04 · EE32015
System Design
Integration: system requirements, interfaces and the full mission demonstrated end to end.
Sections
Design Concept Description
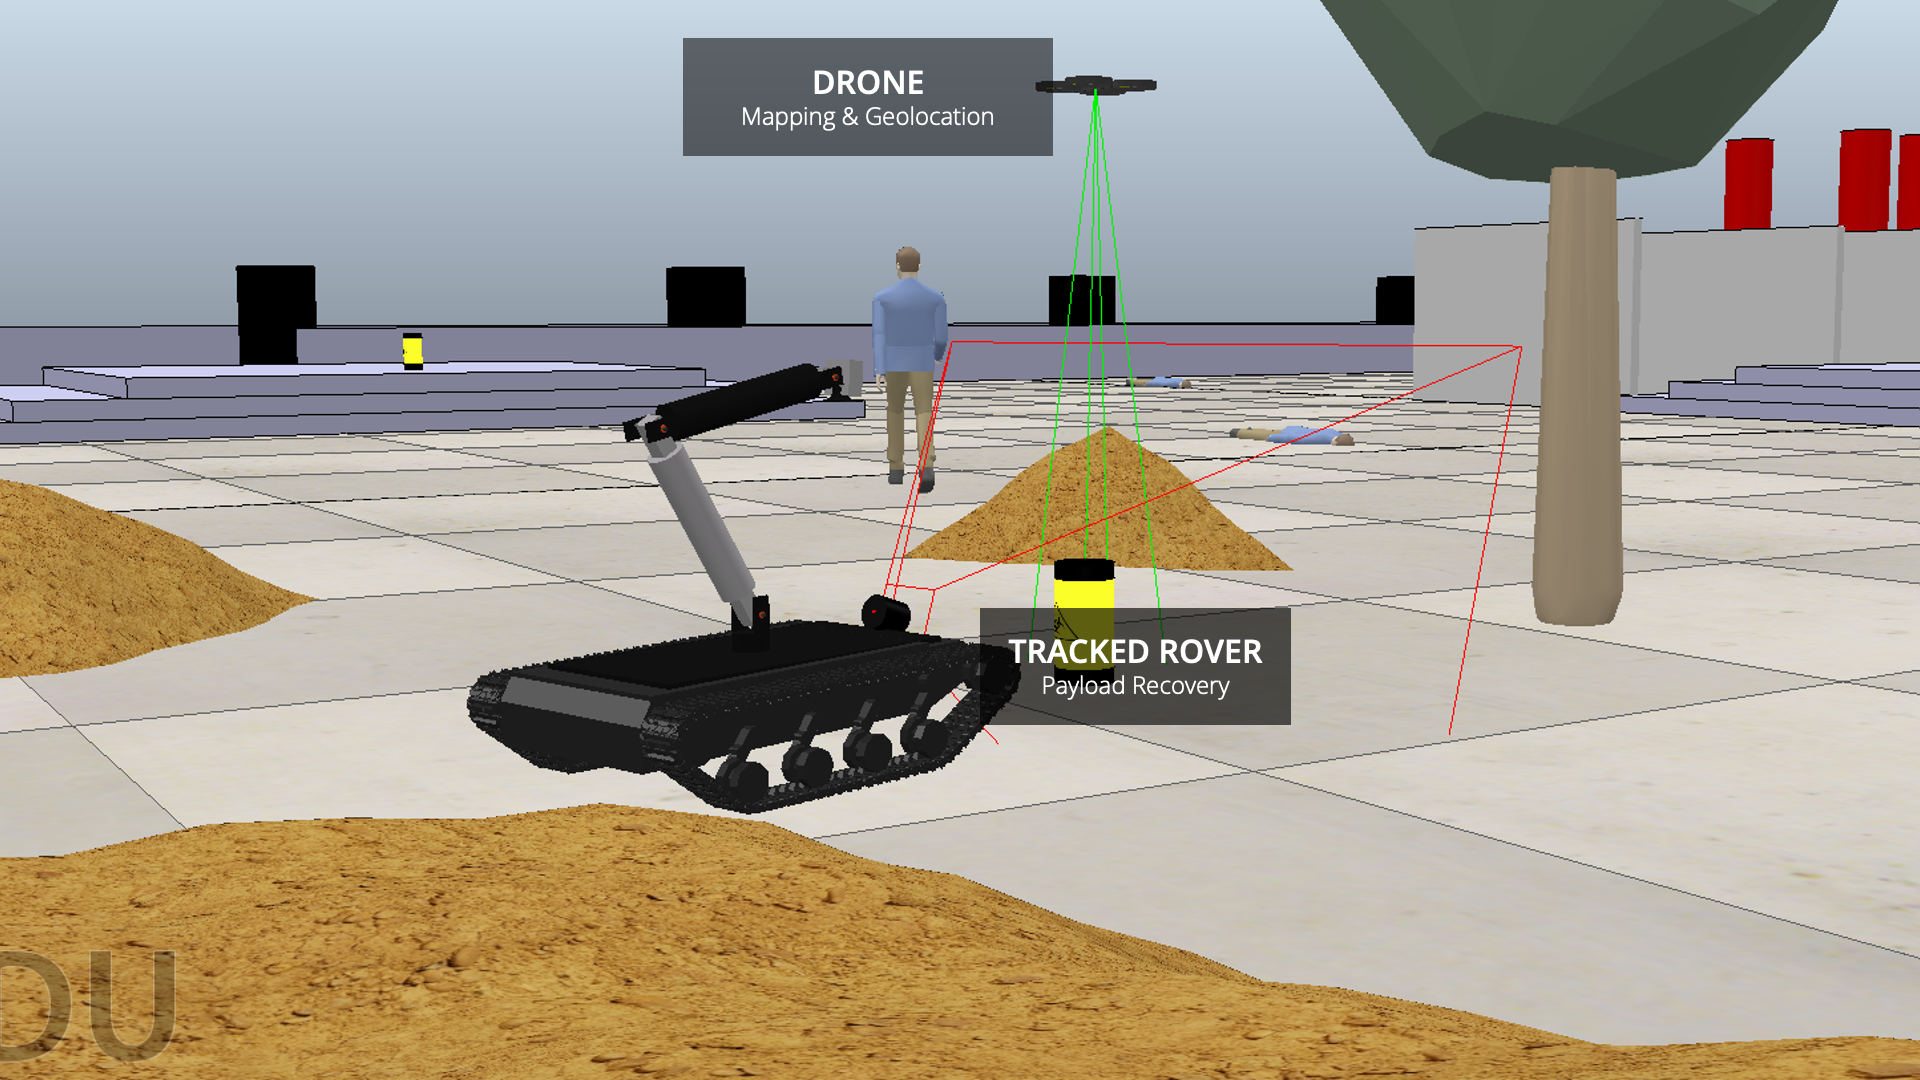
Figure A1 – Full CoppeliaSim system including survey drone.
The proposed system is a hybrid aerial–ground robotic platform for semi-autonomous biohazard recovery. A small survey drone performs rapid geolocation of biohazard containers (and casualties where present), while a tracked ground rover executes local navigation and manipulation. The mission is to locate and recover 12.75kg cylindrical biohazard containers within a 50×50 m single-storey facility containing internal walls, steps, and low-visibility cluttered areas.
Alternative concepts were rejected for clear limitations. A rover-only solution was discarded due to inefficient global search and poor visibility in occluded spaces, making the geolocation requirement difficult to meet within satisfactory mission times. A drone-only approach could not satisfy heavy payload handling and controlled upright placement. The final concept combines fast aerial localisation with robust ground recovery.
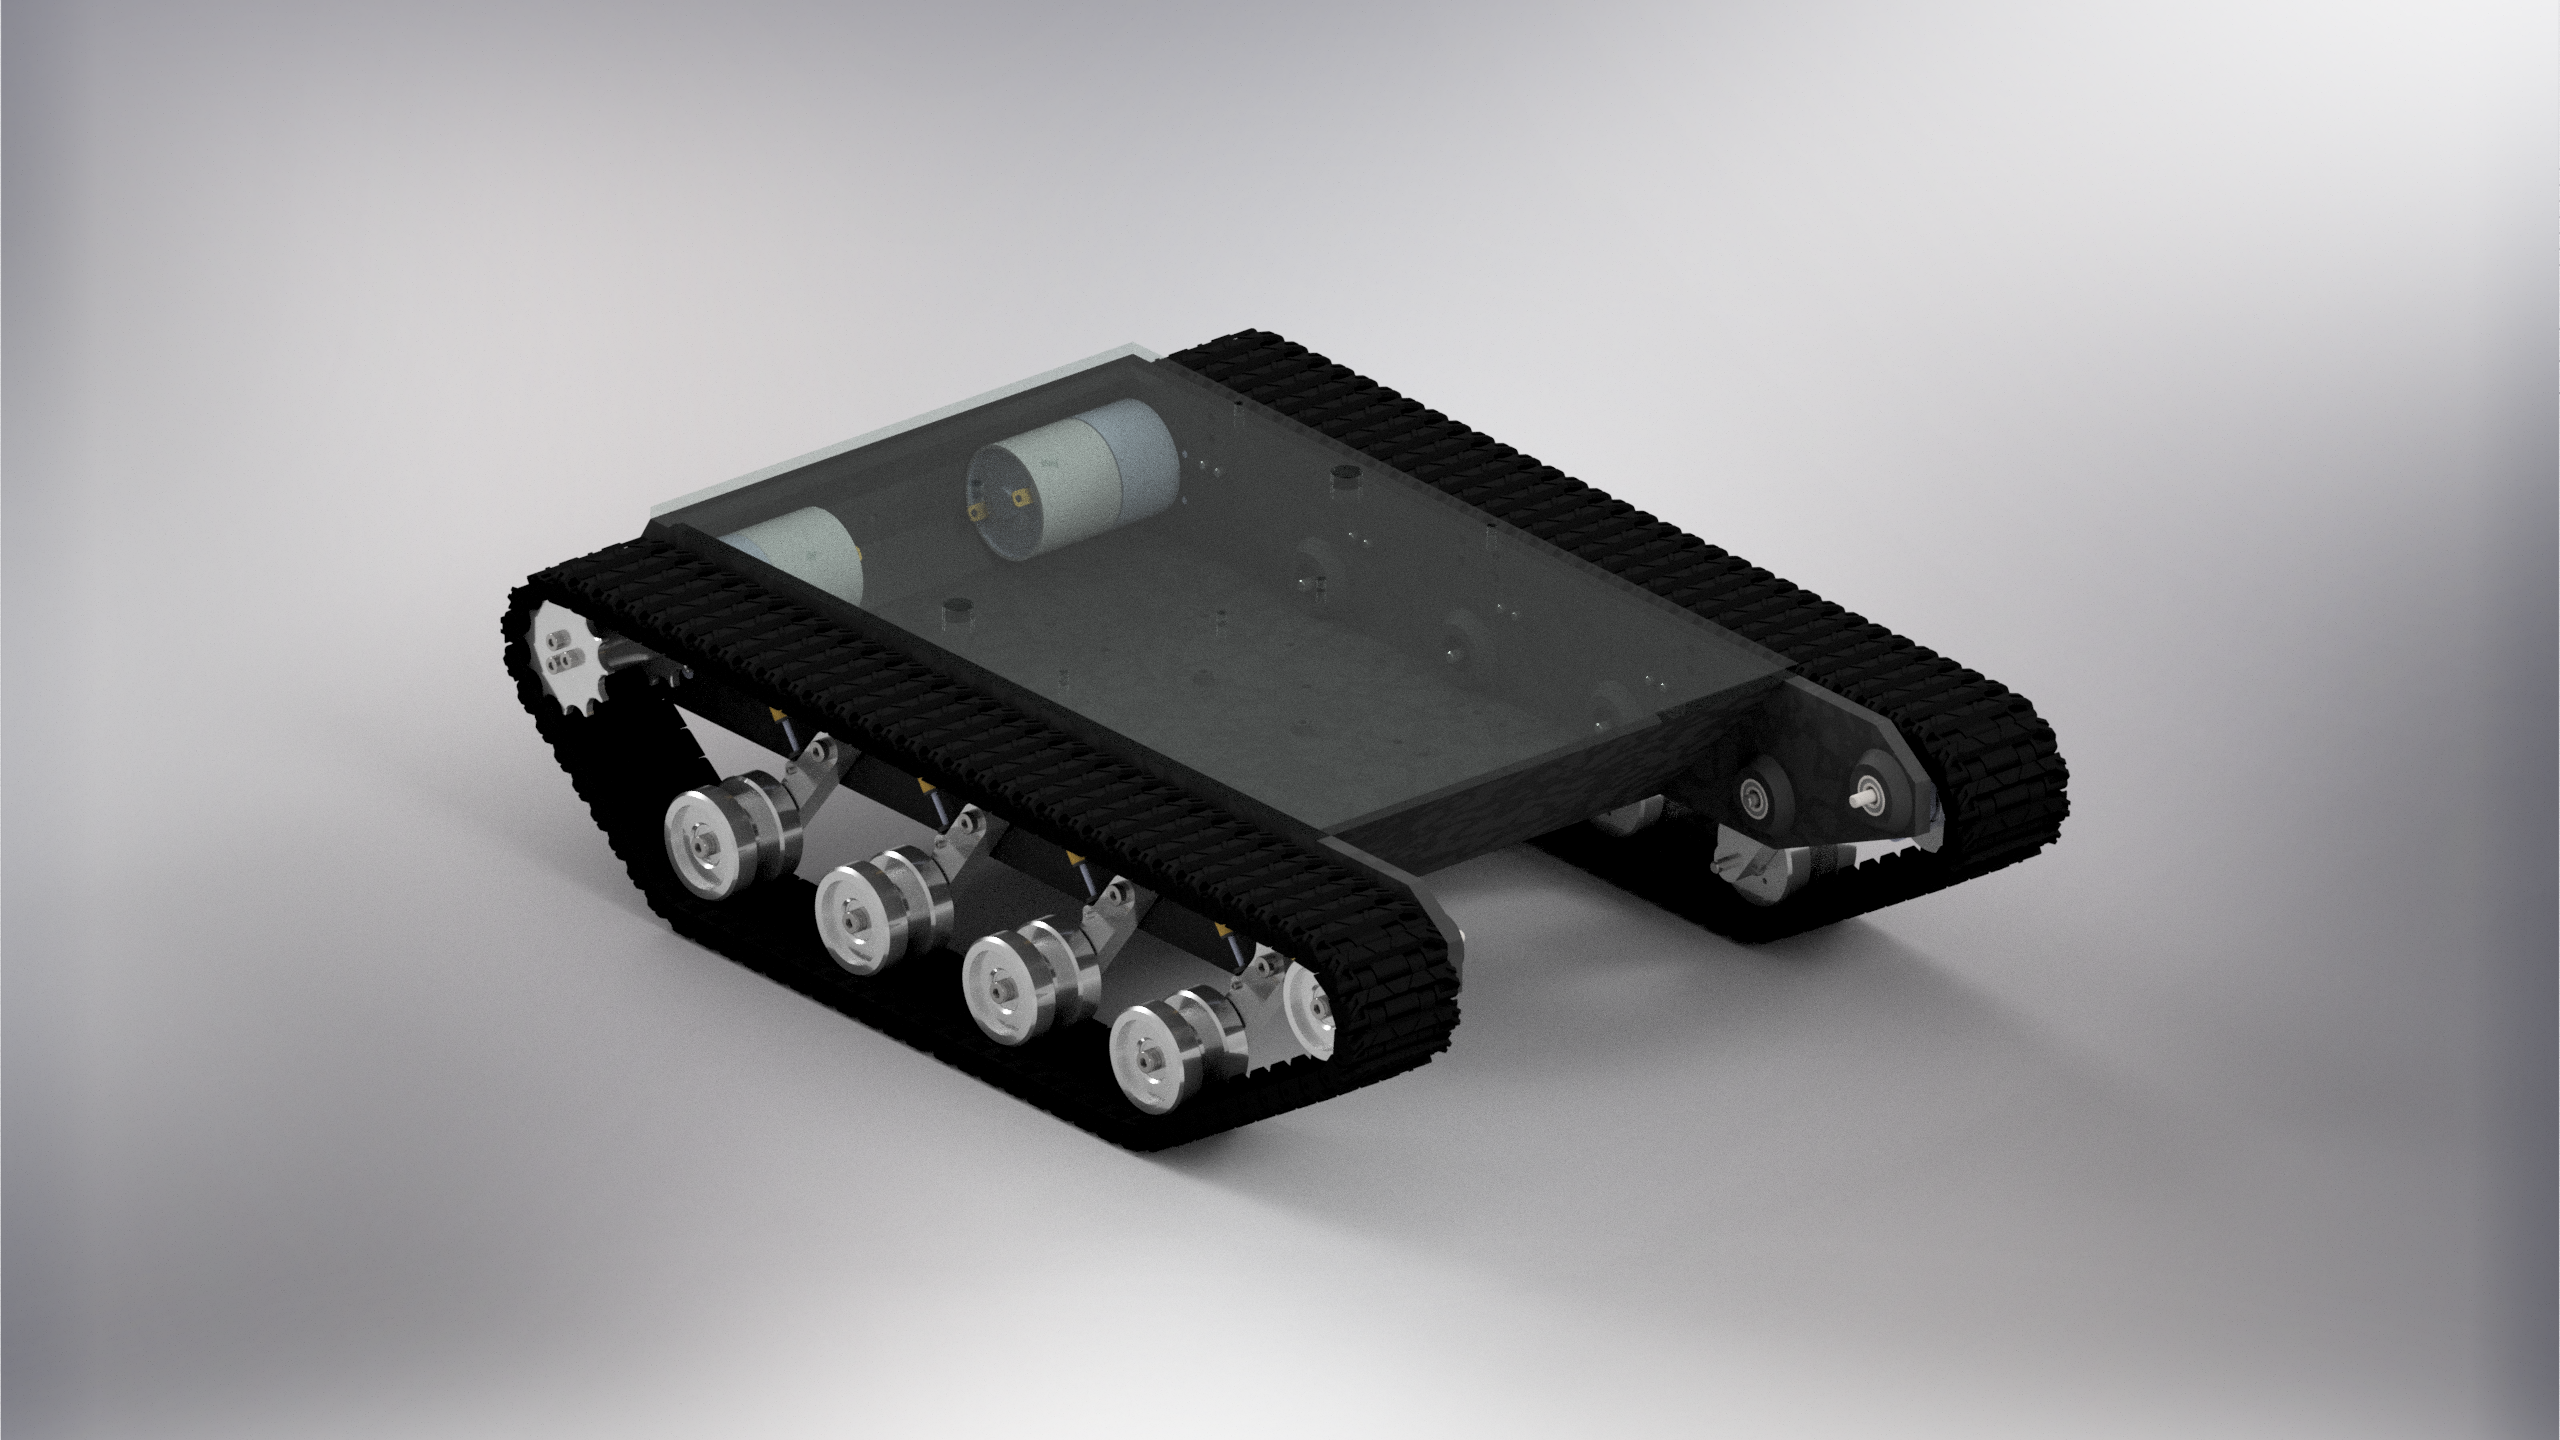
Figure A2 – Chassis CAD design and rover platform.
Rocker–bogie layouts were rejected in favour of a low-profile tracked chassis to maximise stability during terrain negotiation and while manipulating a heavy payload. The rover geometry (L = 1.20m, W = 0.85m) is sized directly from the step, slope and clearance constraints. The chassis and suspension were designed in CAD, with parameters selected to limit pitch and heave during obstacle crossing and arm operation. A Simulink powertrain model was developed to validate motor sizing and energy usage against the mission profile, demonstrating capacity for over eight 8 missions per charge.
Figure A3 – Autonomous biohazard pickup and place, via LiDAR coordinates.
For object handling, multiple gripper concepts were trialled in simulation. Fingered and parallel-jaw grippers were unreliable in CoppeliaSim due to sensitivity to contact modelling. The design therefore converged on a top-down vacuum gripper, which exploits the top flat surface of the biohazards. Combined with autonomous kinematics and control, this robotics subsystem achieves consistent manipulation, with end-effector position error maintained below 0.03m during grasp and placement.
Figure A4 – Aerial LiDAR scan output geolocates biohazards and casualties, and tracks mission status (rover position).
The biohazard environment is characterised by smoke, fire, and degraded visibility, under which appearance-based sensing alone becomes unreliable. Perception is therefore centred on LiDAR-derived depth; the rover LiDAR provides local 3D structure for obstacle awareness and (x, y, z) target localisation for closed-loop manipulation, while also supporting teleoperation in low-visibility conditions. An RGB camera is used as a secondary confirmation channel to verify the yellow biohazard container and safe zone. The drone uses a down-facing LiDAR to survey the facility and produce container and safe-zone geolocations, which are then passed to the operator for efficient mission execution.
Requirements definition and analysis
|
System requirement |
Detail |
Practical considerations |
|
Mission |
||
|
SYS01 Start zone |
System starts entirely within blue Start Zone. |
The system must have a defined startup state until the operator confirms readiness inside a marked start area. |
|
SYS02 Safe zone |
All recovered items deposited inside green safe zone |
In deployment the safe zone would be a physical containment area; the robot must respect clearance margins and detect the area under various lighting and environmental conditions. |
|
SYS03 Biohazard recovery |
Recover all 10 biohazard cylinders within the arena |
Real systems rarely achieve 100% under harsh conditions; requirement would typically be framed as “Recover ≥N within time T” with allowance for retries and occasional failures due to occlusion or inaccessible locations. There will be additional constraints around decontamination and handling procedures which are ignored in simulation. |
|
SYS04 Casualty detection |
Detect and localise all prone casualties. |
In reality, casualty appearance, clothing and pose vary widely. The detection requirement would need to specify operating conditions and acceptable rates. |
|
Environment & Mobility |
||
|
SYS05 Rough ground and slopes |
Must be capable of traversing rough ground and slopes up to 10% without toppling. |
Real terrain includes loose debris and variable friction; performance should be validated on low-μ surfaces. Additional requirements may include slip detection and speed limiting on slopes to reduce loss of control risk. |
|
SYS06 Steps |
Navigate steps of 0.2m height, 0.5m depth and minimum width 1m. |
In practice stairs will have manufacturing tolerances and damage. The physical design must include clearance margin above 0.2m and be tested on a step rig with worn edges. |
|
SYS07 Aperture and rooms |
System must pass through openings as wide as double door, and operate in enclosed rooms ≥3m × 3m × 2m |
Obstacle avoidance should stop near-contact and execute a recovery manoeuvre to prevent collision. |
|
SYS08 Operating endurance and range |
Must perform tasks and endure multiple paths within 100x100m arena, including challenging terrain |
The endurance requirement must account for battery degradation and temperature effects. |
|
Object Handling |
||
|
SYS09 Object properties |
Must be capable of manipulating specified biohazard container: mass 12.75kg, h = 0.4m, d = 0.2m. |
Real containers will not be perfectly identical: fill level, centre of mass and surface condition will vary. Handling procedures might also restrict allowed acceleration to avoid biohazard damage. |
|
SYS10 Payload placement |
Each recovered cylinder shall be placed vertically in the Safe Zone for retrieval to count as successful. |
Compliance in joints and suction pad deformation will increase tilt and positional error. |
|
Perception and mapping |
||
|
SYS11 Detection and localisation |
All biohazards and casualties to be detected, including geolocation of pickup and drop-off positions on a common map. |
Simulation assumes perfect calibration and drift-free localisation; a real system requires explicit sensor calibration procedures (LiDAR-to-base, camera-to-base, GNSS/IMU alignment) and must tolerate drift. |
|
Performance and time |
||
|
SYS12 Mission time |
System shall complete primary mission (10 cylinders) as fast as possible. |
Real deployments must trade speed against safety and reliability. Actual performance will degrade due to compute and network latency and human error. Additional requirements would bound maximum allowed response time for a given incident and may prioritise casualties over containers. |
Figure B1 – Overall systems requirements.
These system-level requirements were decomposed into subsystem-level, quantitative constraints to enable objective verification. For example, SYS05, SYS06 and SYS08 were translated into explicit drivetrain power-electronics constraints on bus current, which were then verified directly via the Simulink power analysis.
Test plan and definition of success
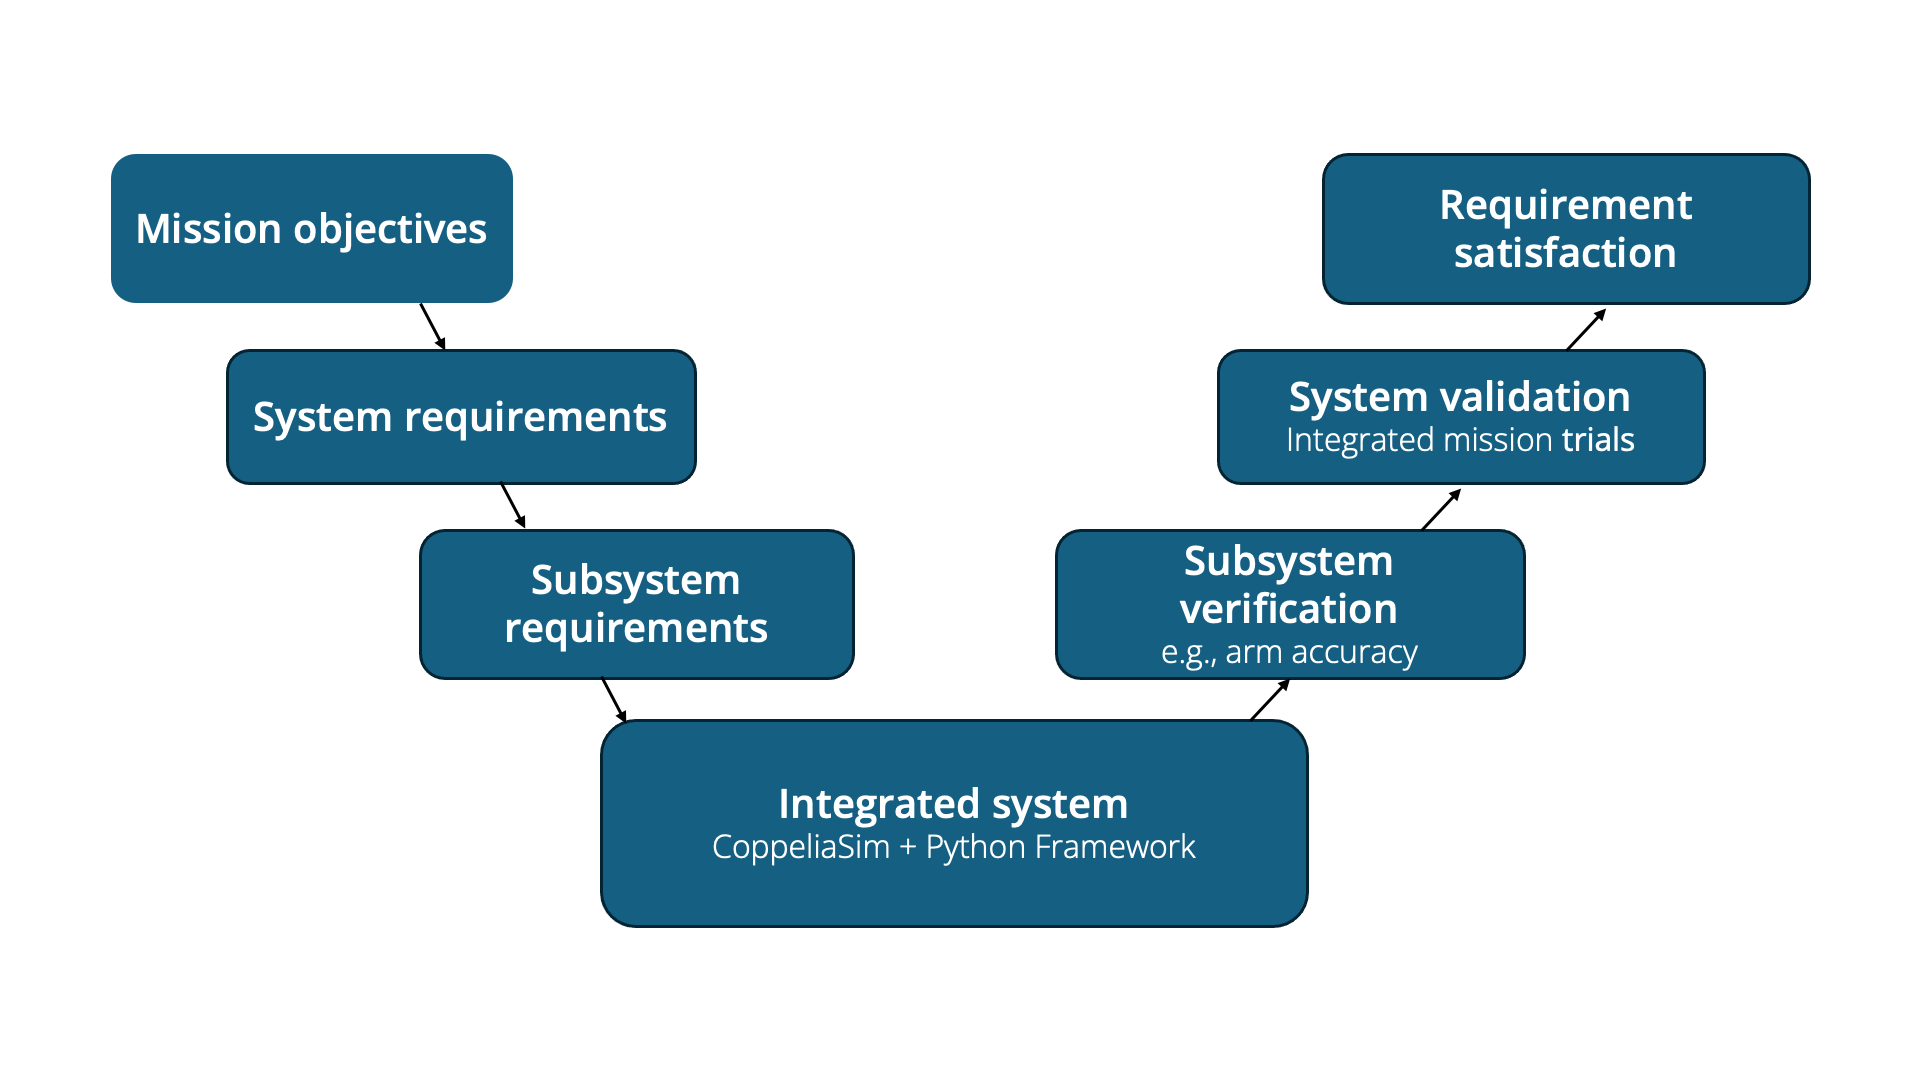
Figure C1 – Systems V-model.
System verification will follow an incremental build, test then integrate strategy, consistent with the Systems V-model shown in Fig. C1, to isolate faults and avoid compounding integration issues.
-
Mobility will be validated first to confirm that the rover can be positioned at target locations under representative terrain conditions.
-
Perception will then be verified in isolation, with LiDAR-based target localisation and RGB colour confirmation tested to ensure accurate biohazard location and rejection of false detections.
-
Manipulation will be integrated next, using an autonomous pick–carry–place routine driven by LiDAR-derived target coordinates, with repeatability assessed via logged end-effector accuracy and cannister tilt angle.
-
System validation will conclude with full mission trials combining drone-based global geolocation and rover-based recovery, exercising the complete sequence (search, localise, recover, place) and logging timing KPIs and success/failure outcomes.
Where simulation under-represents real deployment (e.g. friction variation, lighting effects, calibration drift), the test plan defines equivalent physical tests so that the same pass/fail logic can be reused in practice.
The system-level tests, limitations, and success criteria are defined in Fig. C2.
|
Requirement |
Test |
Subsystem verification |
Success criteria |
|
SYS01 Start zone |
Initialise rover fully inside Start Zone |
Integrated |
Start entirely within Start Zone. |
|
SYS02 Safe zone |
All container final positions inside Safe Zone |
Integrated |
All recovered items deposited inside Safe Zone. |
|
SYS03 Biohazard recovery |
Full mission run across all 10 cylinders |
Integrated |
10/10 cylinders recovered. |
|
SYS04 Casualty detection |
Drone geolocation |
Sensors / drone |
Casualties detected to 0.5m accuracy. |
|
SYS05 Slopes (10%) |
Drive 10% slope |
Mechatronics |
Traverse 10% slope without toppling/immobilisation. |
|
SYS06 Steps (0.2 m) |
Traverse 0.2m steps |
Mechatronics |
Successfully negotiate steps without pitchover. |
|
SYS07 Aperture + rooms |
Doorway + 3×3 m room manoeuvre |
Mechatronics |
Pass through opening and operate in 3×3 m room without collision. |
|
SYS08 Endurance/range |
Run representative mission profile |
Mechatronics |
Total mission energy below battery size by 30% margin |
|
SYS09 Object properties |
Pick/carry the 12.75 kg cylinder. |
Robotics |
Manipulates specified container without drop. |
|
SYS10 Vertical placement |
Measure container tilt after placed. |
Robotics |
Cylinder placed in Safe Zone and remains within tilt limit (e.g., ≤10°) after release. |
|
SYS11 Detect + geolocate |
Drone geolocation |
Sensors |
Targets geolocated in a common map |
|
SYS12 Mission time |
Time full mission |
Integrated |
Report total mission time. |
Figure C2 - System integration test plan.
Detailed design
D1 Software framework:
The complete rover system is comprised of multiple interacting subsystems: teleoperation, LiDAR/RGB perception, skid-steer drive and a 4-DOF arm. To manage these subsystems as a simultaneous closed-loop, integration is managed by a modular Python framework, as summarised in Fig. D1.1:
- A single supervisor process sits at the centre, interfacing operator input, perception modules, and control blocks with the CoppeliaSim. This avoids subsystems issuing simultaneous commands, which would saturate the Python communication channel.
- Operator input is handled by lightweight utilities grouped under the Operator block. These expose only two abstractions to the supervisor: continuous teleoperation commands and discrete events (pick, place, quit).
- Perception is decomposed into two sensor modules. A colour detector performs RGB classification and outputs Boolean flags to verify Safe Zone or biohazard presence.
- In parallel, the LiDAR module receives depth images from CoppeliaSim, internally converting them into a point cloud and extracting candidate targets. Only object type and 3D positionis passed to the supervisor, ensuring that computationally intensive processing is contained within the LiDAR module.
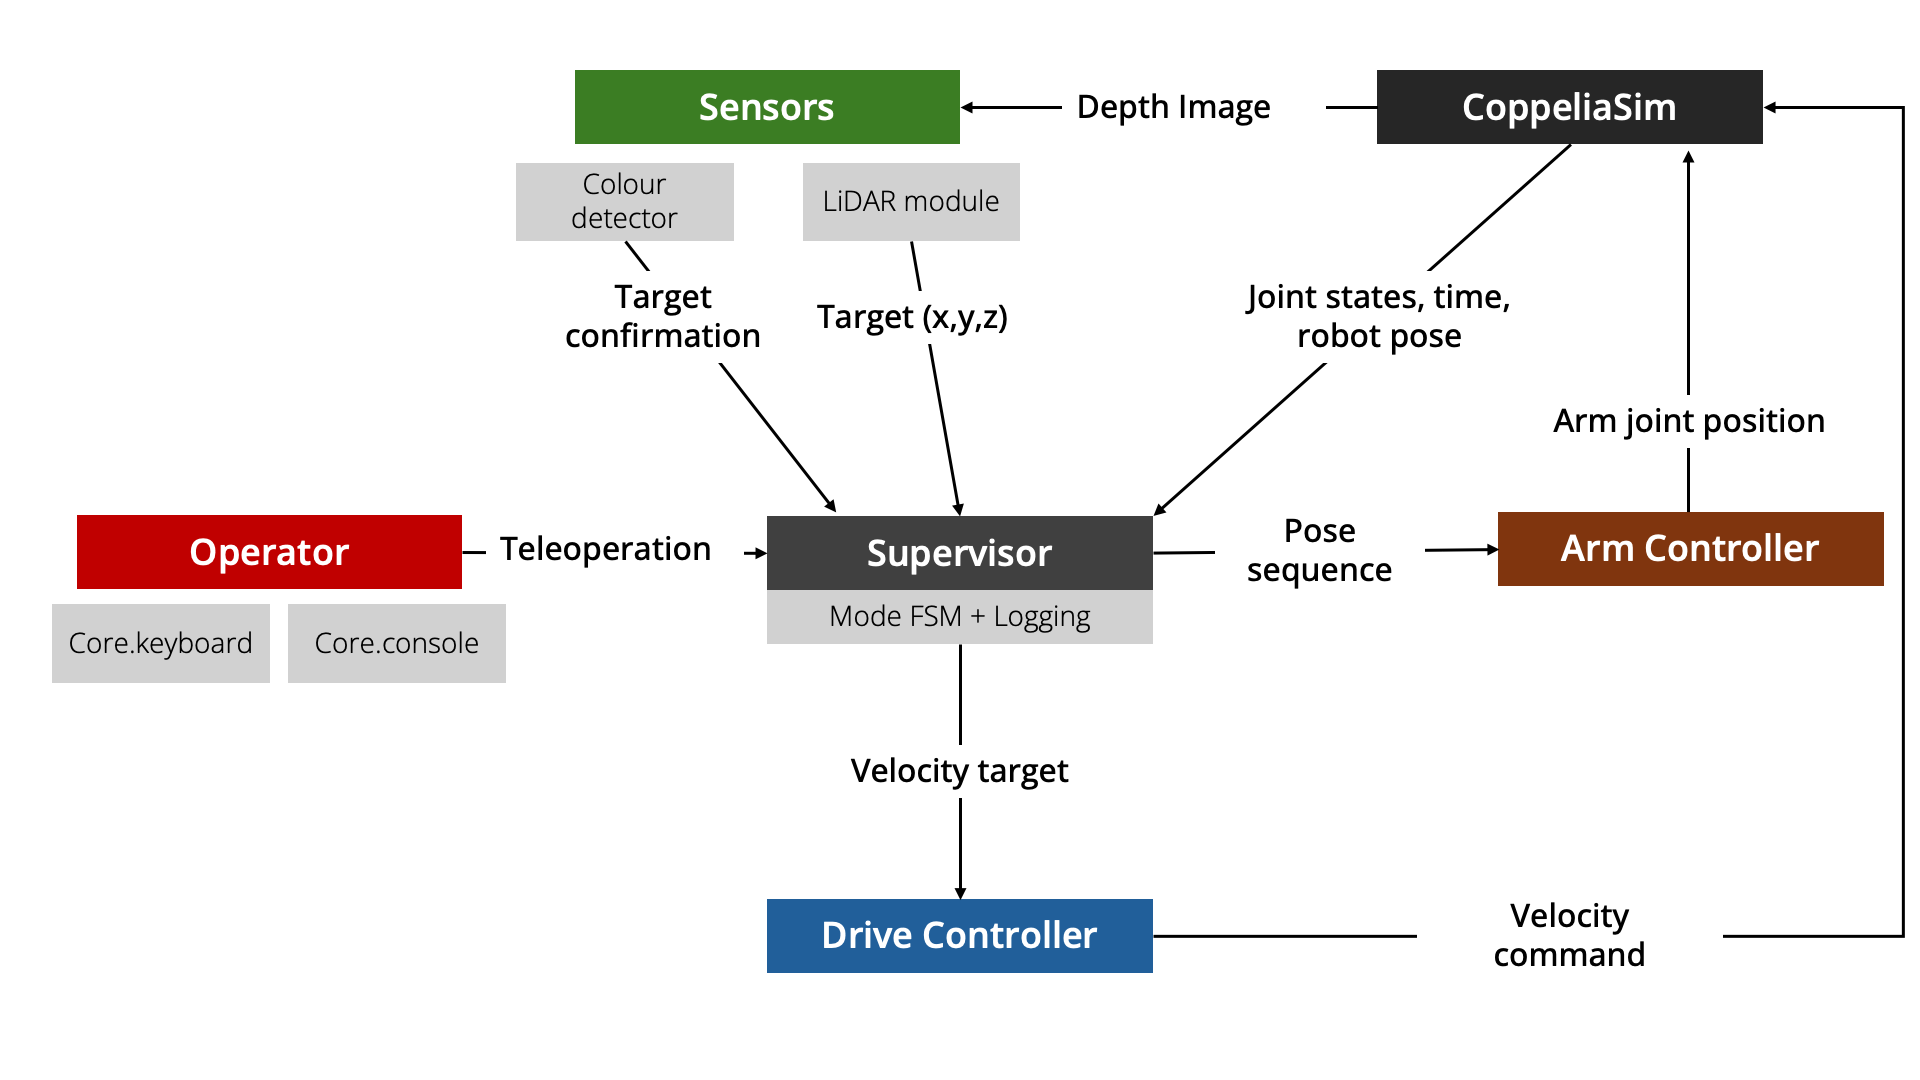
Figure D1.1 – Software framework simplified architecture.
The Supervisor implements the mode finite-state machine and acts as the central decision making layer. It does not issue low-level commands directly. Each subsystem is controlled through a dedicated controller than enforces its own physical and kinematic constraints:
- In driving modes, velocity targets are sent to the Drive Controller, which translates them into left/right track commands.
- In manipulation modes, pose sequences are sent to the Arm Controller, alongside discrete vacuum suction ON/OFF commands. The Arm Controller then performs trajectory generation and analytical inverse kinematics prior to issuing joint position commands.
The software was structured to be directly portable to a ROS deployment. Each block in Fig. D1.1 maps to a ROS node, and each arrow corresponds to a publish/subscribe topic (e.g., target pose, joint states). Simulation-specific processing is contained within individual controller modules so the supervisor only consumes the small set of final outputs, minimising computational load.
Therefore, a hardware transition would benefit from the same supervisor state machine and module architecture, requiring mainly an interface swap from CoppeliaSim to ROS drivers.
D2 Finite-state machine design:
Finite-state machines were implemented to define how the software framework behaves under uncertainty. Their primary purpose is to enforce structured sequencing, bounded autonomy, and explicit failure recovery within the modular architecture described in Section D1.
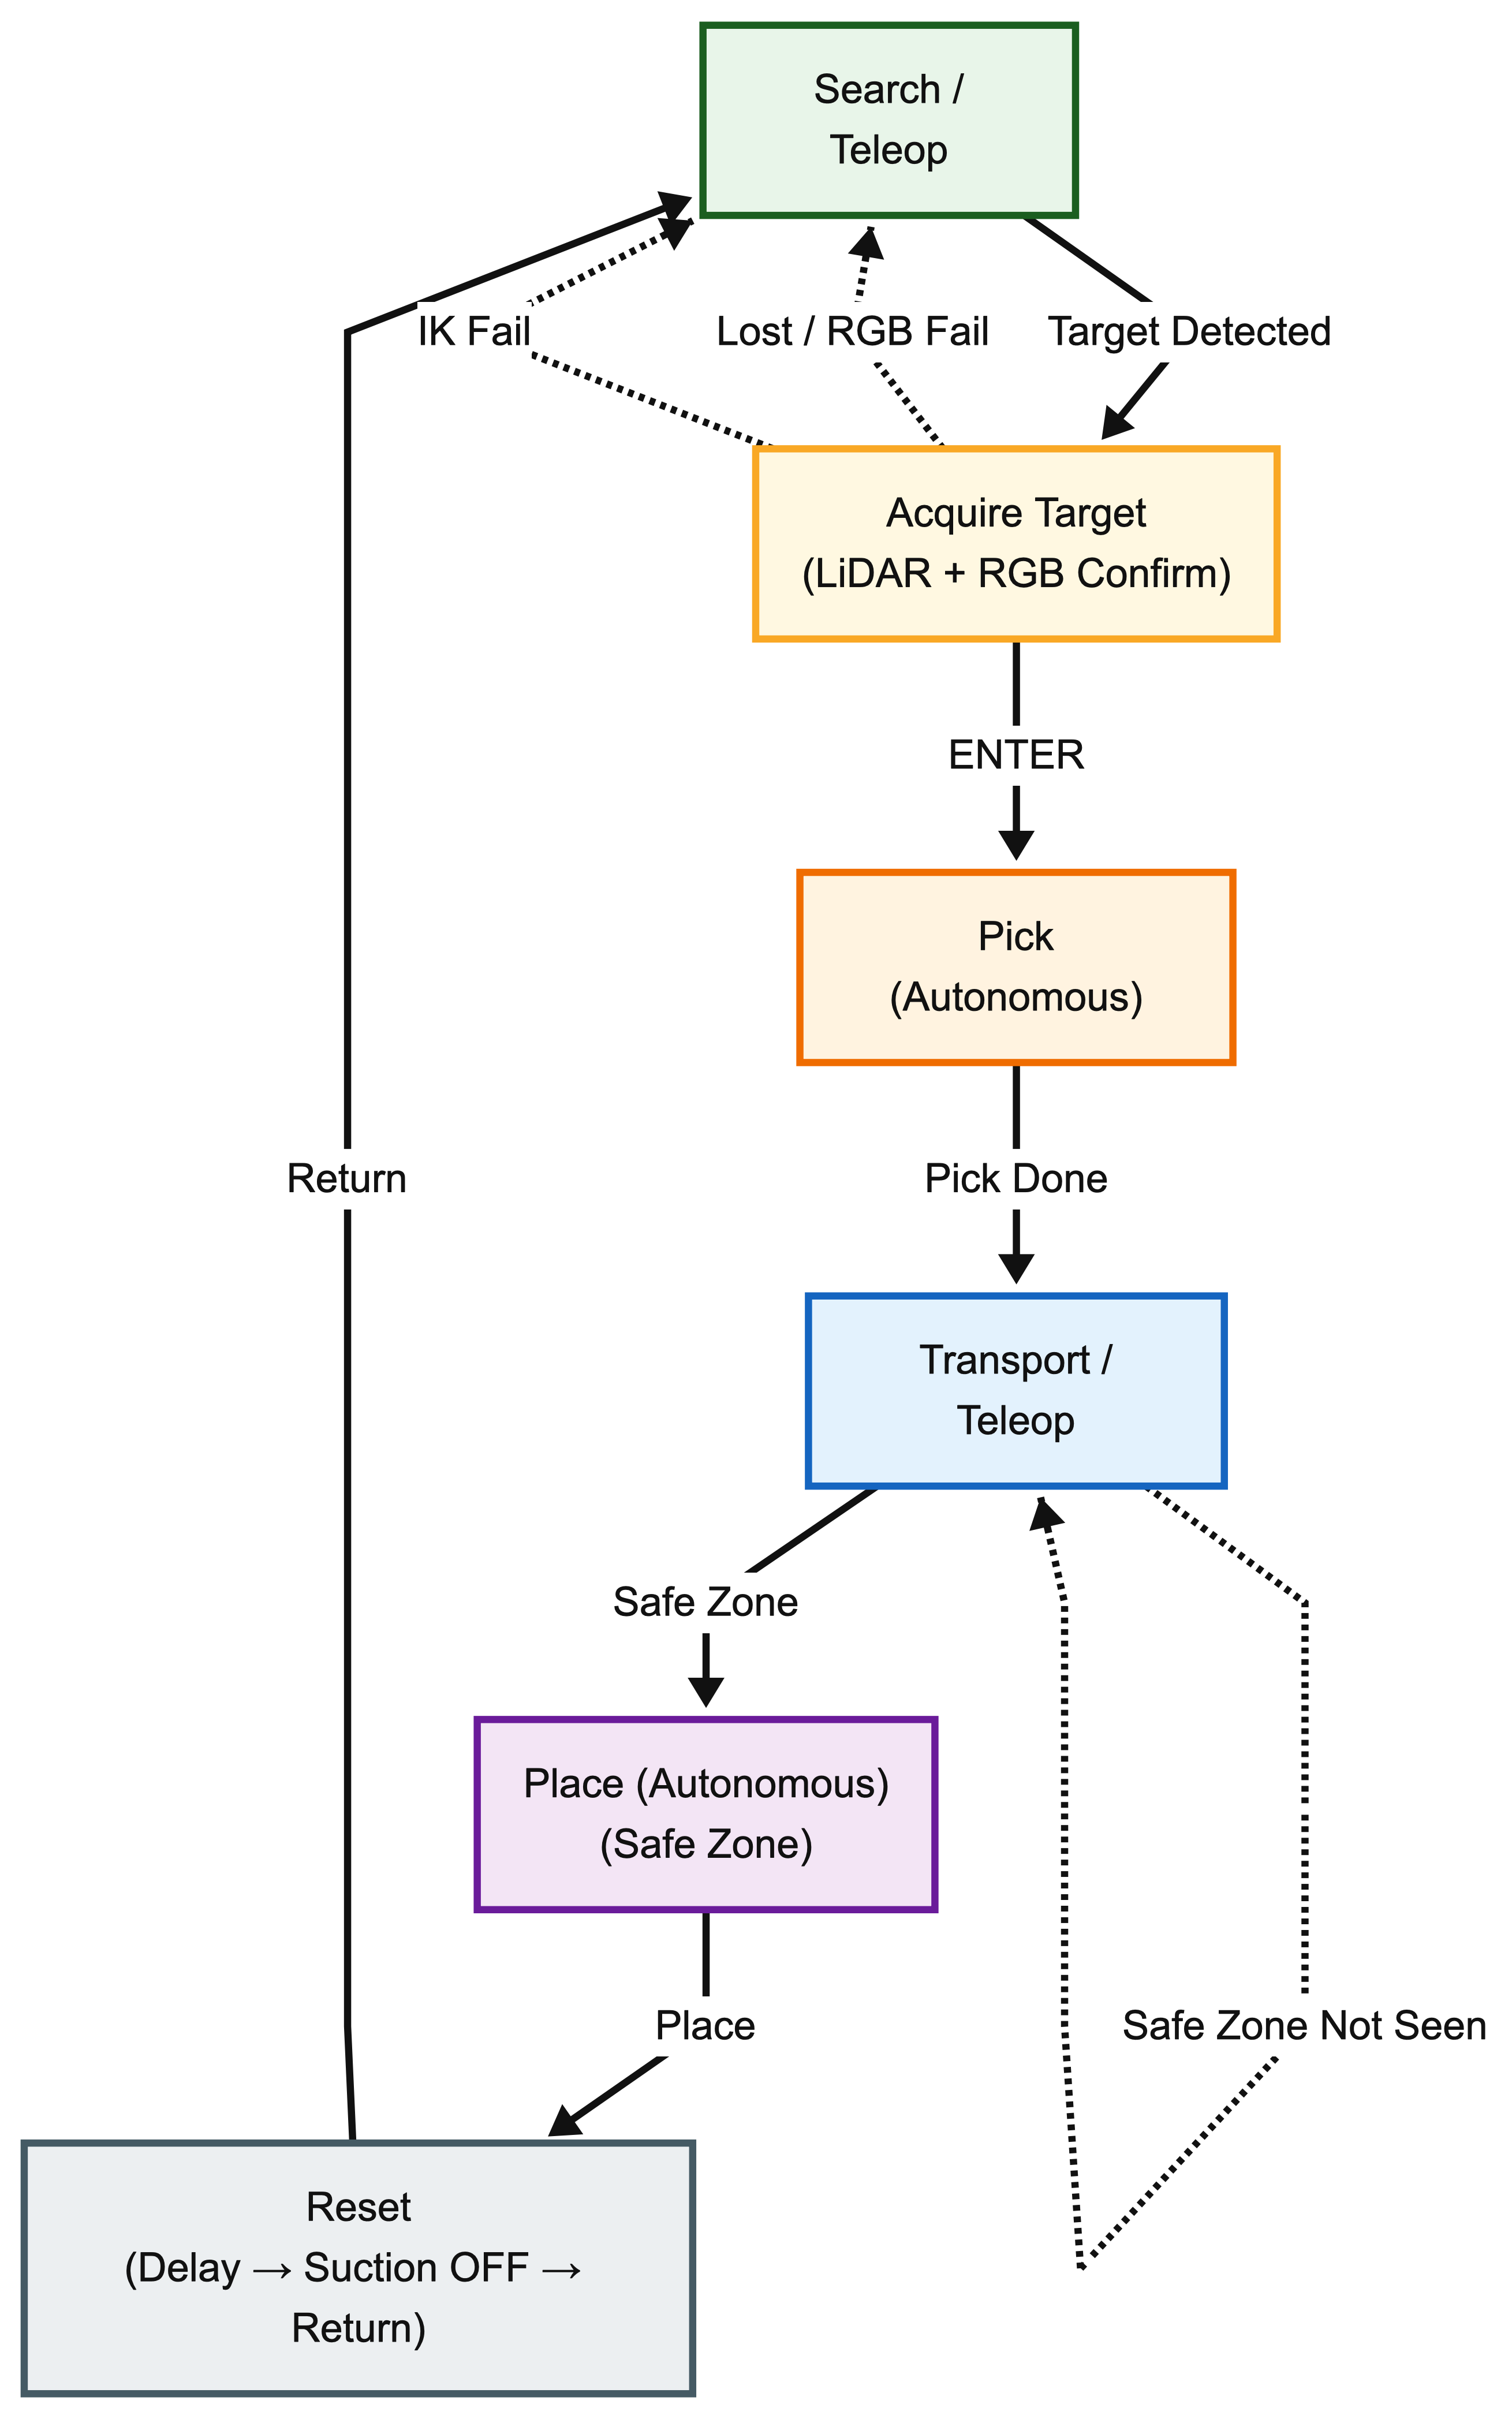
Figure D2.1 – Rover operation state machine.
For the rover, the FSM formalises a hybrid autonomy strategy in which navigation remains operator-led, while manipulation is executed as short, self-contained autonomous sequences. This prevents autonomy from expanding into poorly constrained phases of the mission. Each manipulation attempt is treated as a discrete period with clear entry and exit conditions, ensuring that partial execution cannot occur. From a systems perspective, this bounds risk and ensures the effect of each autonomous action is predictable.
The FSM also provides explicit failure containment. Perception dropouts, inverse-kinematics infeasibility, or loss of confirmation signals trigger immediate reversion to a supervisory state rather than allowing execution to worsen. This is critical for repeated operations: errors are resolved within a single biohazard pick cycle, preventing arm position errors from compounding over time and leading to unintended motion.
The reset and return sequence further ensure that each biohazard recovery attempt begins from a known mechanical and logical baseline, enabling consistent batch testing and repeatable performance.
Event-triggered state transitions are used deliberately. Autonomous actions are only committed when both perception conditions and operator intent are satisfied, reducing unnecessary arm motion and preventing low-confidence manipulation. This design choice trades greater levels of autonomy for reliability.
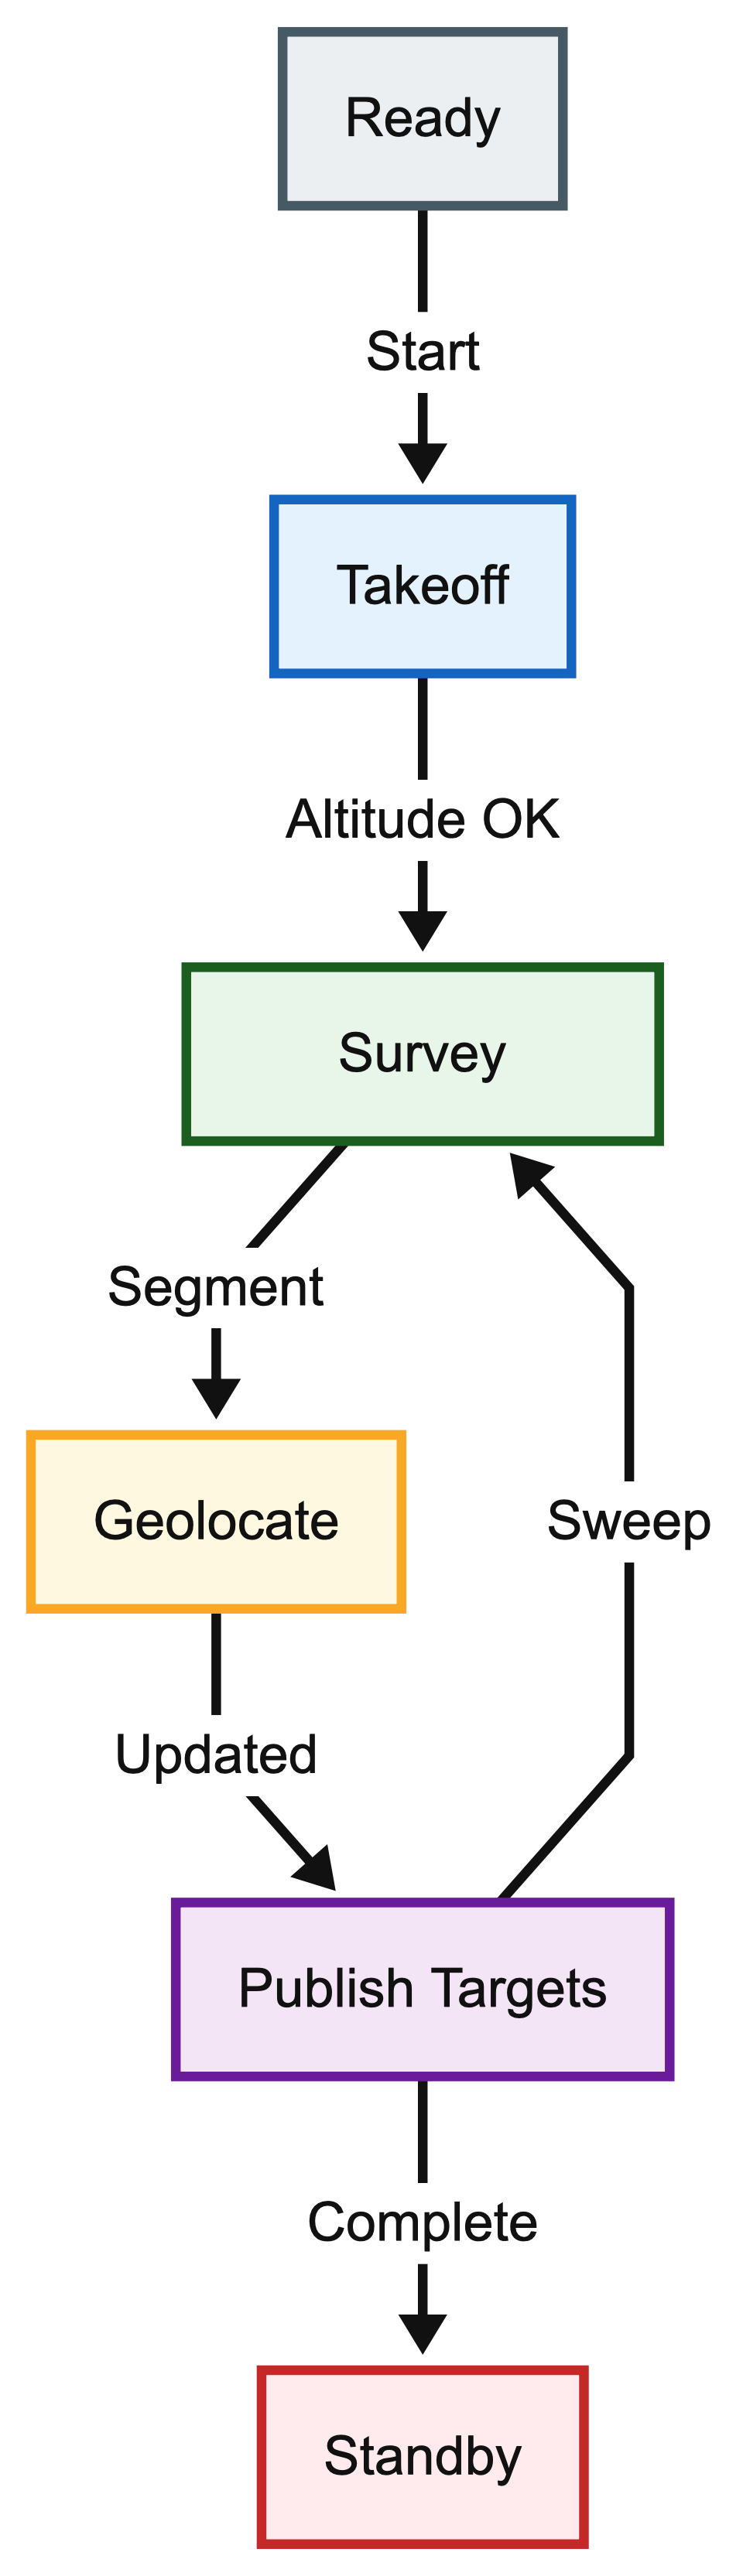
Figure D2.2 – Drone surveillance state machine.
The drone FSM constrains aerial autonomy to the geolocation of biohazards and casualties. The rover operator depends only on this output, not on the drone’s internal behaviour, keeping the two platforms loosely coupled while still integrating through a common map representation.
Overall, the FSMs convert the modular framework into an easily verifiable system: mission phases are explicit, transitions are gated by measurable conditions, and failures return the system to a recoverable state.
D3 Practical design considerations:
Figure D3.1 – LiDAR depth visualisation.
1) Low-visibility operation
The biohazard scenario presents degraded visibility due to smoke and fire. In this instance, purely appearance-based sensing becomes unreliable.
For this reason, perception is explicitly centred on LiDAR-derived depth rather than RGB imagery. LiDAR provides geometry-based obstacle awareness and target localisation that is invariant to lighting and visual obscurants, while RGB is retained only as a short-range confirmation channel.
To support practical teleoperation under these conditions, the rover LiDAR stream is rendered as a real-time depth-map visualisation, allowing the operator to navigate and avoid obstacles even when the camera feed is partially or fully compromised (Figure D3.1).
2) Physically credible dynamics (masses, materials, and actuator limits)
System dynamics were deliberately constrained to remain physically realistic rather than exploiting simulator freedoms. A CAD-derived mass budget with minimum, nominal, and worst-case bounds was compiled, giving a maximum system mass of up to 82.0kg.
These bounds informed mobility sizing and energy modelling. Simulated motors in simulation are limited using hardware derived torque and speed constraints for both the tracked drivetrain and the manipulator, and compliance is verified by logging simulation data during representative manoeuvres.
This prevents non-representative performance that simulators otherwise permit. Structural elements of the arm are modelled as hollow 6061-T6 aluminium sections, sized using a von Mises stress workflow with explicit geometric constraints.
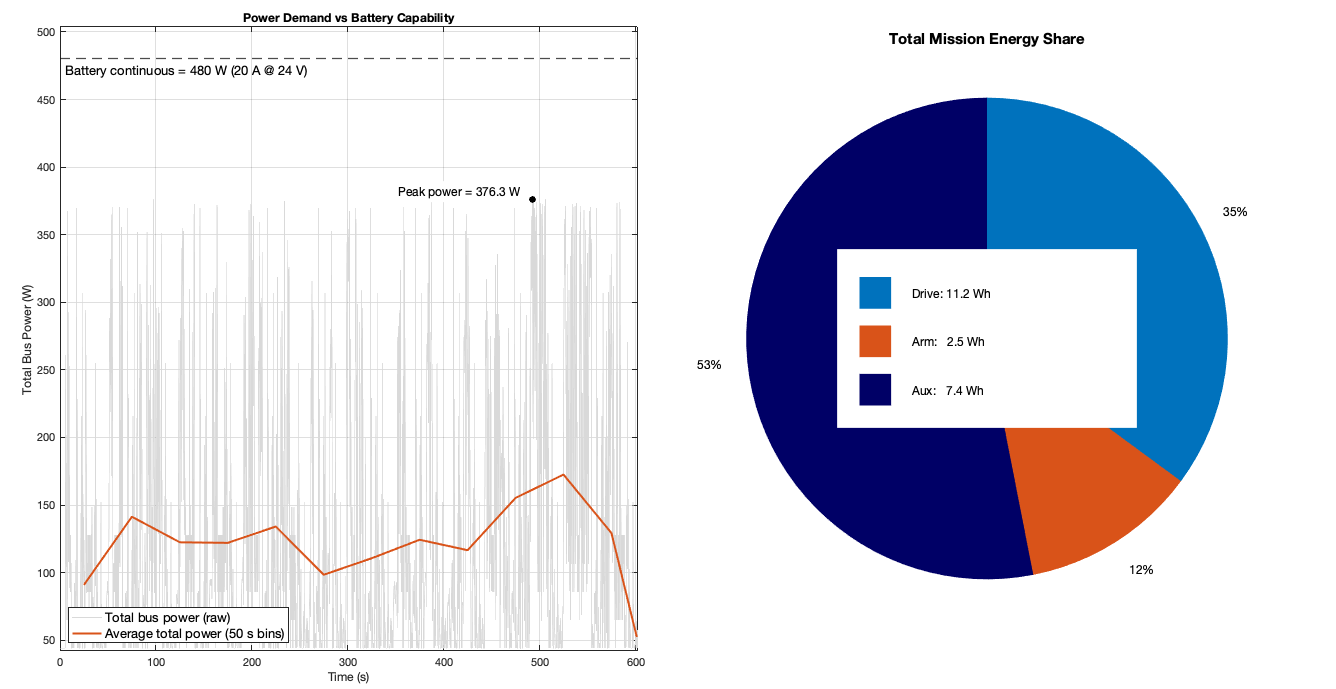
Figure D3.2 – Peak drivetrain power versus battery continuous allowance.
3) Conservative margins (robustness to uncertainty)
Key components were selected with conservative margins to tolerate unmodelled losses such as friction, track compliance, and terrain variability.
The selected drive motors provide more than a 2× torque margin. At mission level, endurance is evaluated using a Simulink energy model driven by logged torque and speed data from representative mission runs rather than assumed duty cycles.
This analysis predicts a consumption of 21.1Wh per full mission, enabling approximately 8 missions per charge with the selected battery pack. The resulting margin provides tolerance to battery ageing and reduced performance in cold conditions.
Test results
A full end-to-end mission trial was executed to validate integrated operation. The primary evidence is the final full-mission demonstration video (Figure E1), supported by subsystem quantitative plots where appropriate. The integrated run demonstrates closed-loop performance of the complete system pipeline, with mission time and success outcomes summarised as a KPI table (Table E3).
Time to recover all 10 biohazard was 6 minutes 28 seconds.
Figure E1 – Full integrated mission demonstration.
|
Requirement |
Success criteria |
Discussion (evidence + key numbers) |
Outcome |
|
SYS01 Start zone |
Start entirely within Start Zone. |
Verified from Figure E1 demonstrating the rover is fully inside Start Zone at initialisation. |
PASS |
|
SYS02 Safe zone |
All recovered items deposited inside Safe Zone. |
Final state in Figure E1 shows all recovered cylinders inside Safe Zone. |
PASS |
|
SYS03 Biohazard recovery |
10/10 cylinders recovered. |
Full mission run achieved 10/10 recovery (Figure E1).
Manipulation reliability is supported by 20/20 successful autonomous holds in Robotics trials. |
PASS |
|
SYS04 Casualty detection |
Casualties detected to 0.5 m accuracy. |
Drone aerial mapping achieved median position error 0.10m (Figure E4). |
PASS |
|
SYS05 Slopes (10%) |
Traverse 10% slope without toppling/immobilisation. |
Mechatronics terrain test demonstrates maximum pitch of 2.3° vs 32° pitch over limit. |
PASS |
|
SYS06 Steps (0.2 m) |
Successfully negotiate steps without pitch over. |
Mechatronics terrain test demonstrates maximum pitch of 2.3° vs 32° pitch over limit. |
PASS |
|
SYS07 Aperture + rooms |
Pass through opening and operate in 3×3 m room without collision. |
Confined-space manoeuvre in Mechatronics integrated arena. |
PASS |
|
SYS08 Endurance/range |
Total mission energy below battery size by 30% margin. |
Mission energy is calculated at 21.1Wh, therefore one mission consumes only 12% of usable capacity. (Figure E6) |
PASS |
|
SYS09 Object properties |
Manipulates specified container without drop. |
Robotics validation achieved 20/20 successful autonomous pick-place cycles without detachment, and the integrated run completes the mission without drops (Figure E1). |
PASS |
|
SYS10 Vertical placement |
Cylinder placed in Safe Zone and remains within tilt limit (e.g., ≤10°) after release. |
Robotics trials show all autonomous placements remain below the 10° tilt threshold (Figure E5). |
PASS |
|
SYS11 Detect + geolocate |
Targets geolocated in a common map. |
Drone mapping outputs detects all targets within world frame (Figure E4). |
PASS |
|
SYS12 Mission time |
Report total mission time. |
Full mission time 06:30mins. |
PASS |
Figure E2 – Whole system test matrix.
|
Metric |
Value |
|
Total mission time |
06:30mins |
|
Containers recovered |
10/10 |
|
Average time per container |
39.0 s |
|
Throughput |
1.54 containers/min |
|
Mission energy (model) |
21.1Wh |
|
Peak bus current (model/log) |
15.68 A |
|
Drone geolocation error (median) |
0.10 m |
Figure E3 – Mission KPI summary.
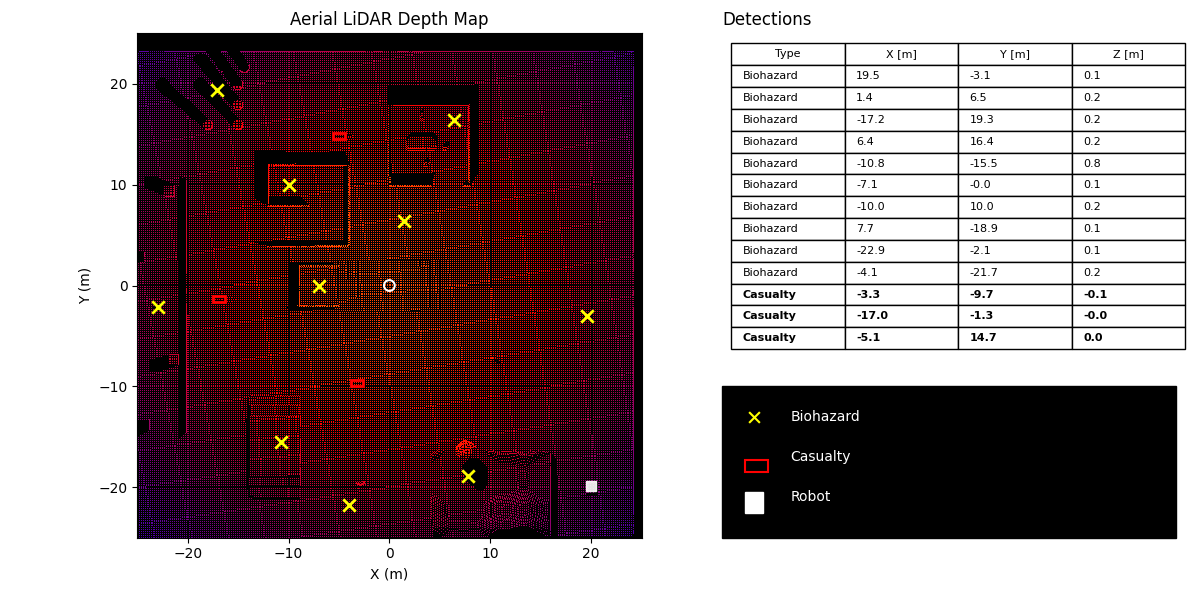
Figure E4 – Drone geolocation map with detected targets.
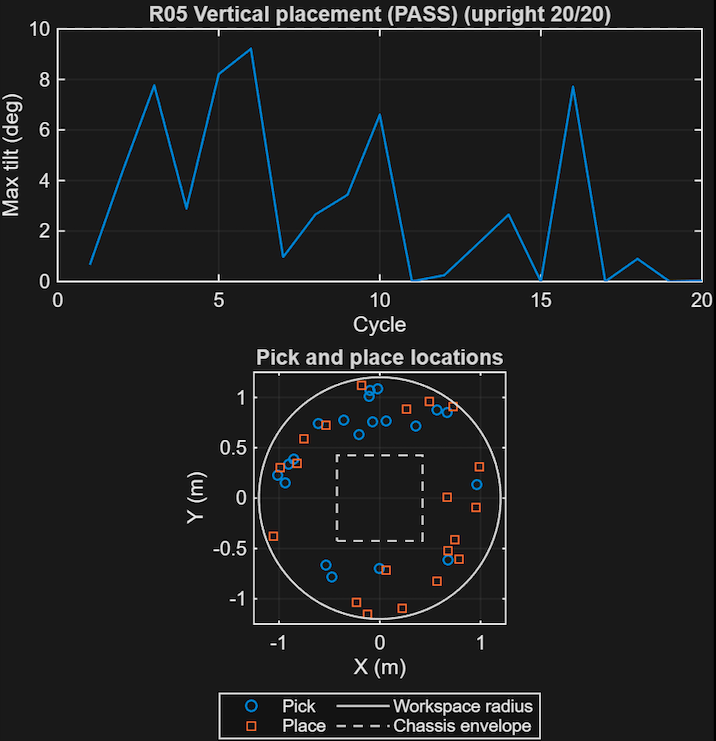
Figure E5 – 100% below 10° tilt threshold for randomised payload pick-place sweep.
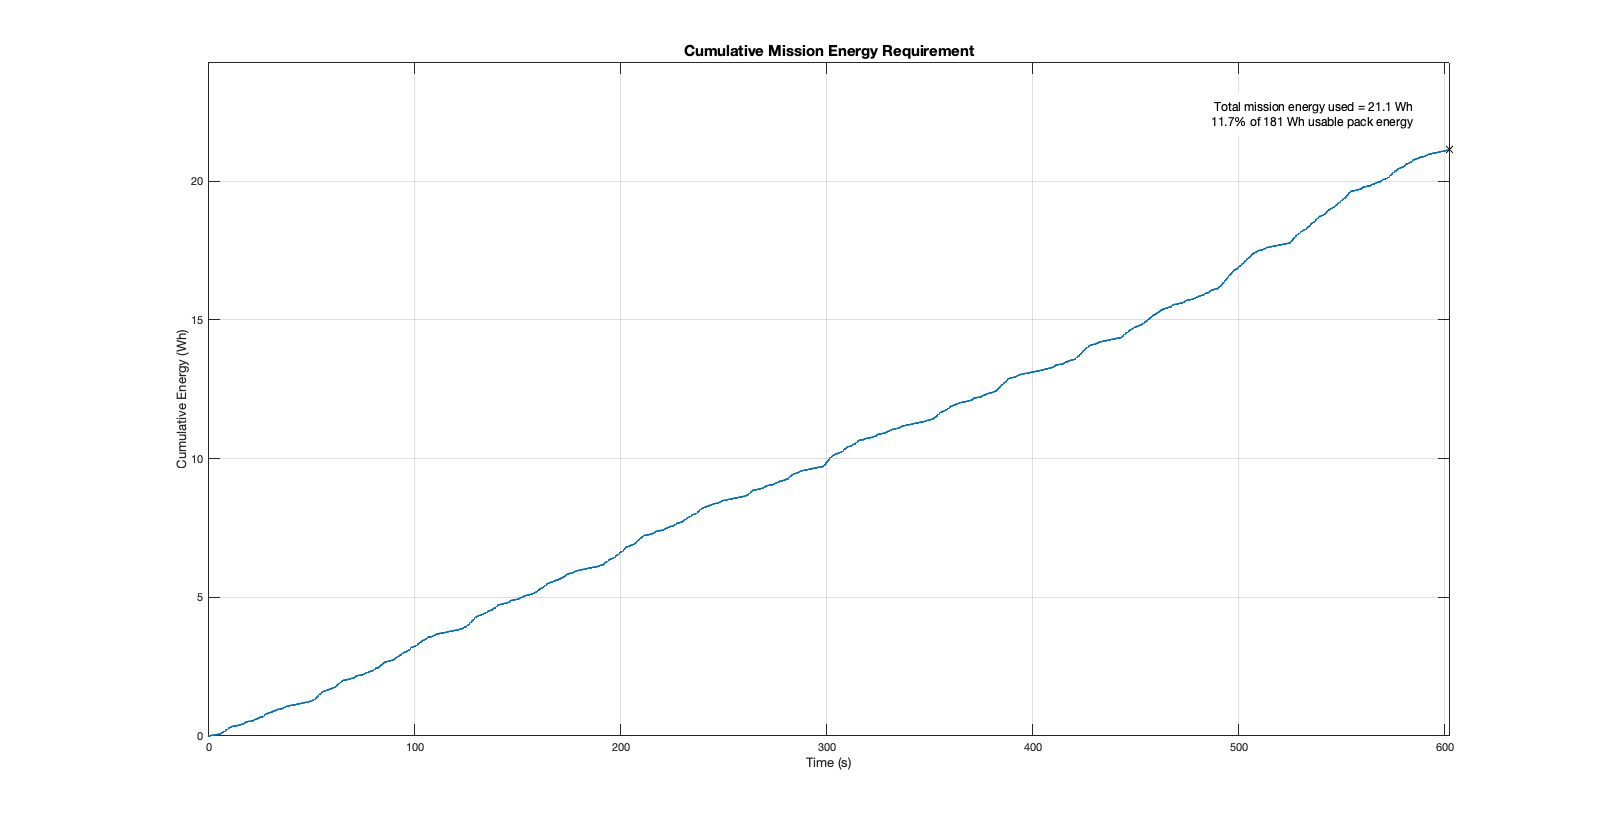
Figure E6 – 8 missions can be completed per battery charge.
Design Reflection
The integrated platform demonstrates end-to-end system performance beyond margins. A full mission run achieved 10/10 container recoveries in 06:30 min, corresponding to 39.0s per container (1.54 containers/min). Energy modelling shows 21.1Wh total consumption with a 15.68A peak bus current, leaving substantial battery capacity. Namely, the rover can operate for 8 missions per charge. The aerial mapping layer achieved a 0.10m median geolocation error, enabling rapid target acquisition.
This performance is enabled by a deliberately bounded autonomy architecture. The drone is constrained to a single, verifiable output: a world-frame list of geolocated targets, whilst the rover executes operator-led navigation with discrete autonomous pick-place cycles. The use of state machines prevents error accumulation on the robotic arm.
At subsystem level, manipulation performance supports system timing. End-effector tracking error remained below 0.05m with a mean 18.06s pick–place cycle time, and structural margin remains high.
The primary limitation observed is logistical throughput. Single-item transport forces repeated return trips between the biohazard locations and the Safe Zone, so mission time becomes dominated by traverse distance rather than pick–place cycle time. With hindsight, the system would be redesigned around batch transport using a lightweight trailer module (Figure F1), shifting the bottleneck in performance from navigation distance to loading rate.
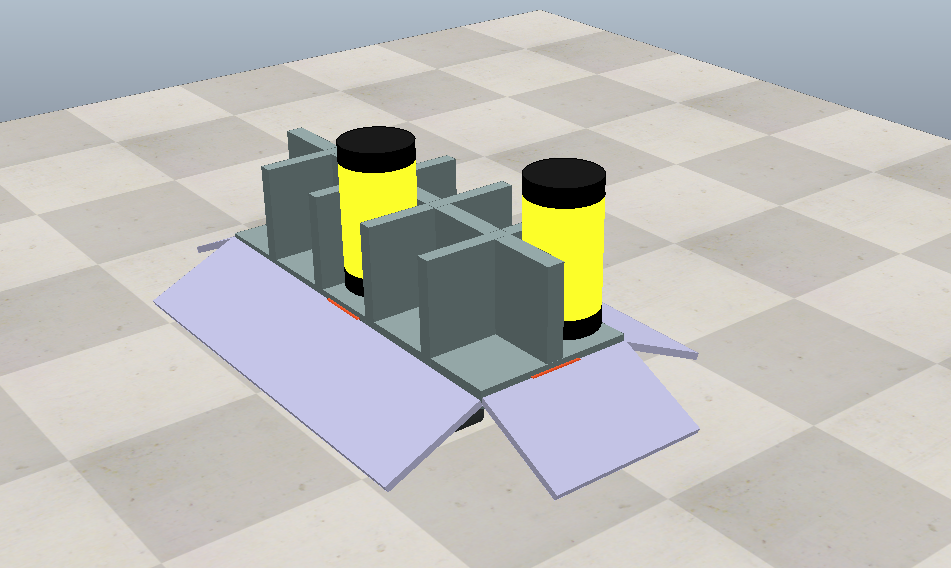
Figure F1 - Biohazard trailer concept.